DBMS Benchmarker Python Package
{include} ../README.md
Overview
This documentation contains
an example of how to perform a TPC-H-like Benchmark from a command line
an illustration of the concepts
an illustration of the evaluations
a description of the options and configurations
some use-cases and test scenarios
examples of how to use the interactive inspector
examples of how to use the interactive dashboard
Example: TPC-H
This example shows how to benchmark 22 reading queries Q1-Q22 derived from TPC-H in MySQL
The query file is derived from the TPC-H and as such is not comparable to published TPC-H results, as the query file results do not comply with the TPC-H Specification.
Official TPC-H benchmark - http://www.tpc.org/tpch
Content:
Prerequisites
We need
a local instance of MySQL
having a database
databasecontaining the TPC-H data of SF=1access rights for user / password:
username/password
a suitable MySQL JDBC driver jar file
JDK 8 installed
If necessary, adjust the settings in the file example/connections.py:
[
  {
    'name': "MySQL",
    'alias': "Some DBMS",
    'version': "CE 8.0.13",
    'docker': 'MySQL',
    'docker_alias': "DBMS A",
    'dialect': "MySQL",
    'hostsystem': {'node': 'localhost'},
    'info': "This is an example: MySQL on localhost",
    'active': True,
    'JDBC': {
      'driver': "com.mysql.cj.jdbc.Driver",
      'url': "jdbc:mysql://localhost:3306/database",
      'auth': ["username", "password"],
      'jar': "mysql-connector-java-8.0.13.jar"
    },
  },
]
Perform Benchmark
Run the command:
python benchmark.py run -e yes -b -f example/tpch
-e yes: This will precompile some evaluations and generate the timer cube.-b: This will suppress some output-f: This points to a folder having the configuration files.
For more options, see the documentation
After benchmarking has been finished will see a message like
Experiment <code> has been finished
The script has created a result folder in the current directory containing the results. <code> is the name of the folder.
Evaluate Results in Dashboard
Run the command:
python dashboard.py
This will start the evaluation dashboard at localhost:8050.
Visit the address in a browser and select the experiment <code>.
Where to go
Use different DBMS
Add metadata
Use Bexhoma
SF
Concepts
Experiment
An experiment is organized in queries. A query is a statement, that is understood by a Database Management System (DBMS).
Single Query
A benchmark of a query consists of these steps:
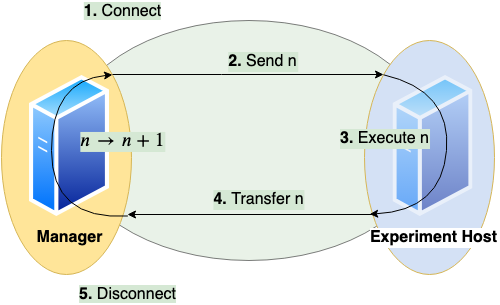
Establish a connection between client and server
This usesjaydebeapi.connect()(and also creates a cursor - time not measured)Send the query from client to server and
Execute the query on server
These two steps useexecute()on a cursor of the JDBC connectionTransfer the result back to client
This usesfetchall()on a cursor of the JDBC connectionClose the connection
This usesclose()on the cursor and the connection
The times needed for steps connection (1.), execution (2. and 3.) and transfer (4.) are measured on the client side. A unit of connect, send, execute and transfer is called a run. Connection time will be zero if an existing connection is reused. A sequence of runs between establishing and discarding a connection is called a session.
Basic Parameters
A basic parameter of a query is the number of runs (units of send, execute, transfer). To configure sessions it is also possible to adjust
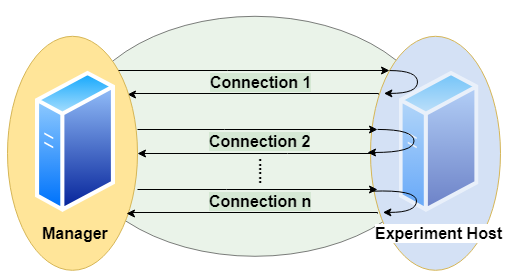
the number of runs per connection (session length, to have several sequential connections) and
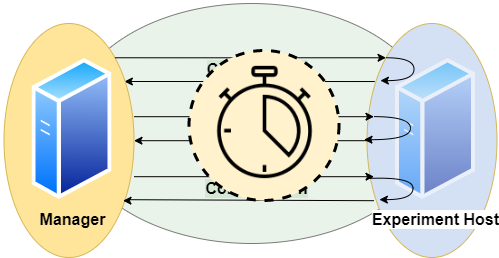
the number of parallel connections (to simulate several simultanious clients)
a timeout (maximum lifespan of a connection)
a delay for throttling (waiting time before each connection or execution)
for the same query.
Parallel clients are simulated using the pool.apply_async() method of a Pool object of the module multiprocessing.
Runs and their benchmark times are ordered by numbering.
Moreover we can randomize a query, such that each run will look slightly different. This means we exchange a part of the query for a random value.
Basic Metrics
We have several timers to collect timing information:
timerConnection
This timer gives the time in ms and per run.
It measures the time it takes to establish a JDBC connection.
Note that if a run reuses an established connection, this timer will be 0 for that run.timerExecution
This timer gives the time in ms and per run.
It measures the time between sending a SQL command and receiving a result code via JDBC.timerTransfer
This timer gives the time in ms and per run.
Note that if a run does not transfer any result set (a writing query or if we suspend the result set), this timer will be 0 for that run.timerRun
This timer gives the time in ms and per run.
That is the sum of timerConnection, timerExecution and timerTransfer.
Note that connection time is 0, if we reuse an established session, and transfer time is 0, if we do not transfer any result set.timerSession
This timer gives the time in ms and per session.
It aggregates all runs of a session and sums up their timerRuns.
A session starts with establishing a connection and ends when the connection is disconnected.
The benchmark times of a query are stored in csv files (optional pickeled pandas dataframe): For connection, execution and transfer. The columns represent DBMS and each row contains a run.
We also measure and store the total time of the benchmark of the query, since for parallel execution this differs from the sum of times based on timerRun. Total time means measurement starts before first benchmark run and stops after the last benchmark run has been finished. Thus total time also includes some overhead (for spawning a pool of subprocesses, compute size of result sets and joining results of subprocesses). Thus the sum of times is more of an indicator for performance of the server system, the total time is more of an indicator for the performance the client user receives.
We also compute for each query and DBMS
Latency: Measured Time
Throughput:
Number of runs per total time
Number of parallel clients per mean time
In the end we have
Per DBMS: Total time of experiment
Per DBMS and Query:
Time per session
Time per run
Time per run, split up into: connection / execution / data transfer
Latency and Throughputs per run
Latency and Throughputs per session
Additionally error messages and timestamps of begin and end of benchmarking a query are stored.
Comparison
We can specify a dict of DBMS. Each query will be sent to every DBMS in the same number of runs.
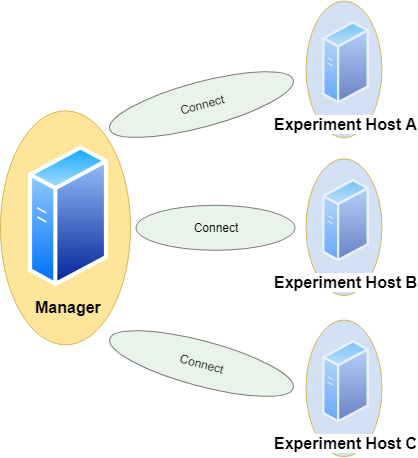
This also respects randomization, i.e. every DBMS receives exactly the same versions of the query in the same order. We assume all DBMS will give us the same result sets. Without randomization, each run should yield the same result set. This tool can check these assumptions automatically by comparison. The resulting data table is handled as a list of lists and treated by this:
# restrict precision
data = [[round(float(item), int(query.restrict_precision)) if tools.convertToFloat(item) == float else item for item in sublist] for sublist in data]
# sort by all columns
data = sorted(data, key=itemgetter(*list(range(0,len(data[0])))))
# size of result
size = int(df.memory_usage(index=True).sum())
# hash of result
columnnames = [[i[0].upper() for i in connection.cursor.description]]
hashed = columnnames + [[hashlib.sha224(pickle.dumps(data)).hexdigest()]]
Result sets of different runs (not randomized) and different DBMS can be compared by their sorted table (small data sets) or their hash value or size (bigger data sets). In order to do so, result sets (or their hash value or size) are stored as lists of lists and additionally can be saved as csv files or pickled pandas dataframes.
Monitoring Hardware Metrics
To make hardware metrics available, we must provide an API URL for a Prometheus Server. The tool collects metrics from the Prometheus server with a step size of 1 second.
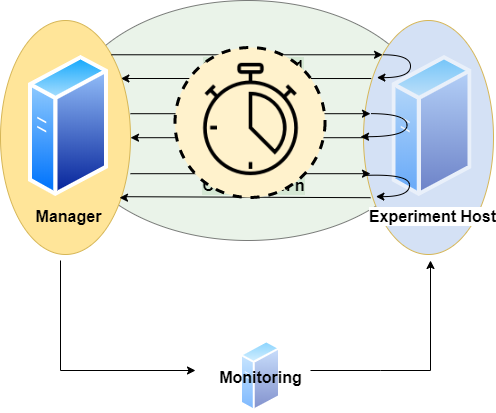
The requested interval matches the interval a specific DBMS is queried. To increase expressiveness, it is possible to extend the scraping interval by n seconds at both ends. In the end we have a list of per second values for each query and DBMS. We may define the metrics in terms of promql. Metrics can be defined per connection.
Example:
'title': 'CPU Memory [MB]'
'query': 'container_memory_working_set_bytes'

'title': 'CPU Memory Cached [MB]'
'query': 'container_memory_usage_bytes'

'title': 'CPU Util [%]'
'query': 'sum(irate(container_cpu_usage_seconds_total[1m]))'

'title': 'CPU Throttle [%]'
'query': 'sum(irate(container_cpu_cfs_throttled_seconds_total[1m]))'

'title': 'CPU Util Others [%]'
'query': 'sum(irate(container_cpu_usage_seconds_total{id!="/"}[1m]))'

'title': 'Net Rx [b]'
'query': 'sum(container_network_receive_bytes_total{)'

'title': 'Net Tx [b]'
'query': 'sum(container_network_transmit_bytes_total{)'

'title': 'FS Read [b]'
'query': 'sum(container_fs_reads_bytes_total)'

'title': 'FS Write [b]'
'query': 'sum(container_fs_writes_bytes_total)'

'title': 'GPU Util [%]'
'query': 'DCGM_FI_DEV_GPU_UTIL{UUID=~"GPU-4d1c2617-649d-40f1-9430-2c9ab3297b79"}'

'title': 'GPU Power Usage [W]'
'query': 'DCGM_FI_DEV_POWER_USAGE{UUID=~"GPU-4d1c2617-"}'

'title': 'GPU Memory [MiB]'
'query': 'DCGM_FI_DEV_FB_USED{UUID=~"GPU-4d1c2617-"}'
Note this expects monitoring to be installed properly and naming to be appropriate. See https://github.com/Beuth-Erdelt/Benchmark-Experiment-Host-Manager for a working example and more details.
Note this has limited validity, since metrics are typically scraped only on a basis of several seconds. It works best with a high repetition of the same query.
Evaluation
As a result we obtain measured times in milliseconds for the query processing parts: connection, execution, data transfer.
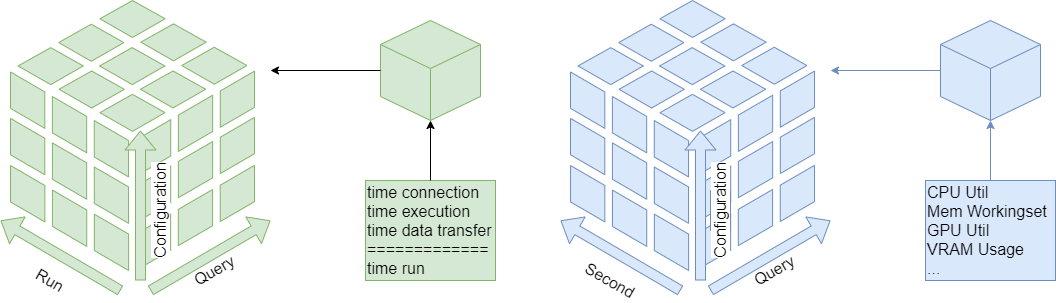
These are described in three dimensions: number of run, number of query and configuration. The configuration dimension can consist of various nominal attributes like DBMS, selected processor, assigned cluster node, number of clients and execution order. We also can have various hardware metrics like CPU and GPU utilization, CPU throttling, memory caching and working set. These are also described in three dimensions: Second of query execution time, number of query and number of configuration.
All these metrics can be sliced or diced, rolled-up or drilled-down into the various dimensions using several aggregation functions for evaluation.
Aggregation Functions
Currently the following statistics may be computed per dimension:
Sensitive to outliers
Arithmetic mean
Standard deviation
Coefficient of variation
Insensitive to outliers
Median - percentile 50 (Q2)
Interquartile range - Q3-Q1
Quartile coefficient of dispersion
First
Last
Minimum
Maximum
Range (Maximum - Minimum)
Sum
Geometric Mean
percentile 25 (Q1)
percentile 75 (Q3)
percentile 90 - leave out highest 10%
percentile 95 - leave out highest 5%
In the complex configuration dimension it can be interesting to aggregate to groups like same DBMS or CPU type.
Use Cases
Use Cases may be
Compare 1 Query in 2 DBMS
and combinations like compare n queries in m DBMS.
Scenarios may be
Benchmark 1 Query in 1 DBMS
We want to measure how long it takes to run one query in a DBMS.
The following performs a counting query 10 times against one DBMS. The script benchmarks the execution of the query and also the transfer of data. The result (the number of rows in table test) is stored and should be the same for each run.
connections.config:
[
  {
    'name': "MySQL",
    'version': "CE 8.0.13",
    'info': "This uses engine innodb",
    'active': True,
    'JDBC': {
      'driver': "com.mysql.cj.jdbc.Driver",
      'url': "jdbc:mysql://localhost:3306/database",
      'auth': ["username", "password"],
      'jar': "mysql-connector-java-8.0.13.jar"
    },
  },
]
queries.config:
{
  'name': 'A counting query',
  'queries':
  [
    {
      'title': "Count all rows in test",
      'query': "SELECT COUNT(*) FROM test",
      'numRun': 10,
      'timer':
      {
        'datatransfer':
        {
          'active': True,
          'compare': 'result'
        },
      }
    },
  ]
}
Compare 2 Queries in 1 DBMS
We want to compare run times of two queries in a DBMS.
The following performs a query 10 times against two DBMS each.
This helps comparing the relevance of position of ordering in the execution plan in this case.
The script benchmarks the execution of the query and also the transfer of data.
The result (some rows of table test in a certain order) is stored and should be the same for each run.
Beware that storing result may take a lot of RAM and disk space!
connections.config:
[
  {
    'name': "MySQL-1",
    'version': "CE 8.0.13",
    'info': "This uses engine innodb",
    'active': True,
    'JDBC': {
      'driver': "com.mysql.cj.jdbc.Driver",
      'url': "jdbc:mysql://localhost:3306/database",
      'auth': ["username", "password"],
      'jar': "mysql-connector-java-8.0.13.jar"
    },
  },
  {
    'name': "MySQL-2",
    'version': "CE 8.0.13",
    'info': "This uses engine innodb",
    'active': True,
    'JDBC': {
      'driver': "com.mysql.cj.jdbc.Driver",
      'url': "jdbc:mysql://localhost:3306/database",
      'auth': ["username", "password"],
      'jar': "mysql-connector-java-8.0.13.jar"
    },
  },
]
queries.config:
{
  'name': 'An ordering query',
  'queries':
  [
    {
      'title': "Retrieve rows in test in a certain order",
      'DBMS': {
        'MySQL-1': "SELECT * FROM (SELECT * FROM test WHERE a IS TRUE) tmp ORDER BY b",
        'MySQL-2': "SELECT * FROM (SELECT * FROM test ORDER BY b) tmp WHERE a IS TRUE",
      },
      'numRun': 10,
      'timer':
      {
        'datatransfer':
        {
          'active': True,
          'compare': 'result'
        },
      }
    },
  ]
}
Compare 2 Databases in 1 DBMS
We want to compare run times of two databases in a DBMS. An application may be having the same tables with different indices and data types to measure influence.
The following performs a query 10 times against two databases in a DBMS each.
This helps comparing the relevance of table structure in this case.
Suppose we have a table test in database database and in database2 resp.
The script benchmarks the execution of the query and also the transfer of data.
The result (the number of rows in table test) is stored and should be the same for each run.
connections.config:
[
  {
    'name': "MySQL",
    'version': "CE 8.0.13",
    'info': "This uses engine innodb",
    'active': True,
    'JDBC': {
      'driver': "com.mysql.cj.jdbc.Driver",
      'url': "jdbc:mysql://localhost:3306/database",
      'auth': ["username", "password"],
      'jar': "mysql-connector-java-8.0.13.jar"
    },
  },
  {
    'name': "MySQL-2",
    'version': "CE 8.0.13",
    'info': "This uses engine myisam",
    'active': True,
    'JDBC': {
      'driver': "com.mysql.cj.jdbc.Driver",
      'url': "jdbc:mysql://localhost:3306/database2",
      'auth': ["username", "password"],
      'jar': "mysql-connector-java-8.0.13.jar"
    },
  },
]
queries.config:
{
  'name': 'A counting query',
  'queries':
  [
    {
      'title': "Count all rows in test",
      'query': "SELECT COUNT(*) FROM test",
      'numRun': 10,
      'timer':
      {
        'datatransfer':
        {
          'active': True,
          'compare': 'result'
        },
      }
    },
  ]
}
Compare 1 Query in 2 DBMS
We want to compare run times of two DBMS. An application may be having the same tables in different DBMS and want to find out which one is faster.
The following performs a query 10 times against two DBMS each.
This helps comparing the power of the two DBMS, MySQL and PostgreSQL in this case.
Suppose we have a table test in both DBMS.
The script benchmarks the execution of the query and also the transfer of data.
The result (the number of rows in table test) is stored and should be the same for each run.
connections.config:
[
  {
    'name': "MySQL",
    'version': "CE 8.0.13",
    'info': "This uses engine innodb",
    'active': True,
    'JDBC': {
      'driver': "com.mysql.cj.jdbc.Driver",
      'url': "jdbc:mysql://localhost:3306/database",
      'auth': ["username", "password"],
      'jar': "mysql-connector-java-8.0.13.jar"
    },
  },
  {
    'name': "PostgreSQL",
    'version': "v11",
    'info': "This uses standard config"
    'active': True,
    'JDBC': {
      'driver': "org.postgresql.Driver",
      'url': "jdbc:postgresql://localhost:5432/database",
      'auth': ["username", "password"],
      'jar': "postgresql-42.2.5.jar"
    },
  },
]
queries.config:
{
  'name': 'A counting query',
  'queries':
  [
    {
      'title': "Count all rows in test",
      'query': "SELECT COUNT(*) FROM test",
      'numRun': 10,
      'timer':
      {
        'datatransfer':
        {
          'active': True,
          'compare': 'result'
        },
      }
    },
  ]
}
Scenarios
Many Users / Few, Complex Queries
Excerpt from connections.config:
'connectionmanagement': {
  'timeout': 600,
  'numProcesses': 20,
  'runsPerConnection': 1
},
That is we allow 20 parallel clients, which connect to the DBMS host to run 1 single query each.
Note the host of the benchmarking tool must be capable of 20 parallel processes.
Excerpt from queries.config:
{
  'title': "Pricing Summary Report (TPC-H Q1)",
  'query': """select
    l_returnflag,
    l_linestatus,
    cast(sum(l_quantity) as int) as sum_qty,
    sum(l_extendedprice) as sum_base_price,
    sum(l_extendedprice*(1-l_discount)) as sum_disc_price,
    sum(l_extendedprice*(1-l_discount)*(1+l_tax)) as sum_charge,
    avg(l_quantity) as avg_qty,
    avg(l_extendedprice) as avg_price,
    avg(l_discount) as avg_disc,
    count(*) as count_order
    from
    lineitem
    where
    l_shipdate <= date '1998-12-01' - interval '{DELTA}'  day
    group by
    l_returnflag,
    l_linestatus
    order by
    l_returnflag,
    l_linestatus
    limit 10000000""",
  'parameter': {
    'DELTA': {
      'type': "integer",
      'range': [60,99]
    },
  },
  'active': True,
  'numRun': 20,
  'timer':
  {
    'datatransfer':
    {
      'active': True,
      'sorted': True,
      'compare': 'hash',
      'store': 'dataframe',
      'precision': 0,
    },
    'connection':
    {
      'active': True,
    }
  }
},
That is each simulated user runs the (randomized) TPC-H query number 1. The result sets will be truncated to no decimals, sorted and compared by their hash values. The result set of the first run will be stored to disk as a pickled pandas dataframe. The time for connection, execution and data transfer will be measured.
Few Users / Several simple Queries
Excerpt from connections.config:
'connectionmanagement': {
  'timeout': 600,
  'numProcesses': 1,
  'runsPerConnection': 5
},
That is we allow only one client at a time, which connects to the DBMS host to run 5 single queries.
Excerpt from queries.config:
{
  'title': "Count rows in nation",
  'query': "SELECT COUNT(*) c FROM nation",
  'active': True,
  'numRun': 20,
  'timer':
  {
    'datatransfer':
    {
      'active': True,
      'sorted': True,
      'compare': 'result',
      'store': 'dataframe',
      'precision': 4,
    },
    'connection':
    {
      'active': True,
    }
  }
},
That is each simulated user counts the number of rows in table nations (five times per connection). We want to have 20 counts in total, so the simulated user (re)connects four times one after the other. The result sets will be truncated to 4 decimals, sorted and compared. The result set of the first run will be stored to disk as a pickled pandas dataframe. The time for connection, execution and data transfer will be measured.
Updated Database
We want to compute a sum, update some value and compute the sum again. This will take place 10 times as a sequence one after the other.
Excerpt from queries.config:
{
  'title': "Sum of facts",
  'query': "SELECT SUM(fact) s FROM facts",
  'active': False,
  'numRun': 1,
},
{
  'title': "Update Facts",
  'query': "UPDATE facts SET fact={FACT} WHERE id={ID}",
  'active': False,
  'numRun': 10,
  'parameter': {
    'FACT': {
      'type': "float",
      'range': [0.05, 20.00]
    },
    'ID': {
      'type': "integer",
      'range': [1,1000]
    },
  },
{
  'title': "Sequence of compute/update/compute",
  'queryList': [1,2,1]
  'active': True,
  'numRun': 30,
  'connectionmanagement': {
    'timeout': 600,
    'numProcesses': 1,
    'runsPerConnection': 3
  }
}
Example Runs
Run benchmarks
python3 benchmark.py run -f test generates a folder containing result files: csv of benchmarks per query.
The example uses test/connections.config and test/queries.config as config files.
Example: This produces a folder containing
connections.config
queries.config
protocol.json
query_1_connection.csv
query_1_execution.csv
query_1_transfer.csv
query_2_connection.csv
query_2_execution.csv
query_2_transfer.csv
query_3_connection.csv
query_3_execution.csv
query_3_transfer.csv
where
connections.configis a copy of the input filequeries.configis a copy of the input fileprotocol.json: JSON file containing error messages (up to one per query and connection), durations (per query) and retried data (per query)query_n_connection.csv: CSV containing times (columns) for each dbms (rows) for query n - duration of establishing JDBC connectionquery_n_execution.csv: CSV containing times (columns) for each dbms (rows) for query n - duration of executionquery_n_transfer.csv: CSV containing times (columns) for each dbms (rows) for query n - duration of data transfer
Run benchmarks and generate evaluations
python3 benchmark.py run -e yes -f test is the same as above, and additionally generates evaluation cube files.
evaluation.dict
evaluation.json
These can be inspected comfortably using the dashboard or the Python API.
Read stored benchmarks
python3 benchmark.py read -r 12345 reads files from folder 12345containing result files and shows summaries of the results.
Generate evaluation of stored benchmarks
python3 benchmark.py read -r 12345 -e yes reads files from folder 12345 containing result files, and generates evaluation cubes.
The example uses 12345/connections.config and 12345/queries.config as config files.
Continue benchmarks
python3 benchmark.py continue -r 12345 -e yes reads files from folder 12345 containing result files, continues to perform possibly missing benchmarks and generates evaluation cubes.
This is useful if a run had to be stopped. It continues automatically at the first missing query.
It can be restricted to specific queries or connections using -q and c resp.
The example uses 12345/connections.config and 12345/queries.config as config files.
Continue benchmarks for more queries
You would go to a result folder, say 12345, and add queries to the query file.
python3 benchmark.py continue -r 12345 -g yes then reads files from folder 12345 and continue benchmarking the new (missing) queries.
Do not remove existing queries, since results are mapped to queries via their number (position). Use ``active`` instead.
Continue benchmarks for more connections
You would go to a result folder, say 12345, and add connections to the connection file.
python3 benchmark.py continue -r 12345 -g yes then reads files from folder 12345 and continue benchmarking the new (missing) connections.
Do not remove existing connections, since their results would not make any sense anymore. Use ``active`` instead.
Rerun benchmarks
python3 benchmark.py run -r 12345 -e yes reads files from folder 12345 containing result files, performs benchmarks again and generates evaluation cubes.
It also performs benchmarks of missing queries.
It can be restricted to specific queries or connections using -q and c resp.
The example uses 12345/connections.config and 12345/queries.config as config files.
Rerun benchmarks for one query
python3 benchmark.py run -r 12345 -e yes -q 5 reads files from folder 12345containing result files, performs benchmarks again and generates evaluation cubes.
The example uses 12345/connections.config and 12345/queries.config as config files.
In this example, query number 5 is benchmarked (again) in any case.
Rerun benchmarks for one connection
python3 benchmark.py run -r 12345 -g yes -c MySQL reads files from folder 12345containing result files, performs benchmarks again and generates evaluation cubes.
The example uses 12345/connections.config and 12345/queries.config as config files.
In this example, the connection named MySQL is benchmarked (again) in any case.
Parameter
Featured Parameters
The lists of DBMS and queries are given in config files in dict format.
Benchmarks can be parametrized by
number of benchmark runs: Is performance stable across time?
number of benchmark runs per connection: How does reusing a connection affect performance?
number of warmup and cooldown runs, if any: How does (re)establishing a connection affect performance?
number of parallel clients: How do multiple user scenarios affect performance?
optional list of timers (currently: connection, execution, data transfer, run and session): Where does my time go?
sequences of queries: How does sequencing influence performance?
optional comparison of result sets: Do I always receive the same results sets?
Benchmarks can be randomized (optionally with specified seeds for reproducible results) to avoid caching side effects and to increase variety of queries by taking samples of arbitrary size from a
list of elements
dict of elements (one-to-many relations)
range of integers
range of floats
range of days
range of (first of) months
range of years
This is inspired by TPC-H and TPC-DS - Decision Support Benchmarks.
Options
Command Line Options and Configuration
How to configure the benchmarker can be illustrated best by looking at the source code of the command line tool benchmark.py, which will be described in the following.
python3 benchmark.py -h
usage: dbmsbenchmarker [-h] [-d] [-b] [-qf QUERY_FILE] [-cf CONNECTION_FILE] [-q QUERY] [-c CONNECTION] [-ca CONNECTION_ALIAS] [-f CONFIG_FOLDER] [-r RESULT_FOLDER] [-e {no,yes}] [-w {query,connection}] [-p NUMPROCESSES] [-s SEED]
                       [-cs] [-ms MAX_SUBFOLDERS] [-sl SLEEP] [-st START_TIME] [-sf SUBFOLDER] [-vq] [-vs] [-vr] [-vp] [-pn NUM_RUN] [-m] [-mps]
                       {run,read,continue}

A benchmark tool for RDBMS. It connects to a given list of RDBMS via JDBC and runs a given list benchmark queries. Optionally some reports are generated.

positional arguments:
  {run,read,continue}   run benchmarks and save results, or just read benchmark results from folder, or continue with missing benchmarks only

optional arguments:
  -h, --help            show this help message and exit
  -d, --debug           dump debug informations
  -b, --batch           batch mode (more protocol-like output), automatically on for debug mode
  -qf QUERY_FILE, --query-file QUERY_FILE
                        name of query config file
  -cf CONNECTION_FILE, --connection-file CONNECTION_FILE
                        name of connection config file
  -q QUERY, --query QUERY
                        number of query to benchmark
  -c CONNECTION, --connection CONNECTION
                        name of connection to benchmark
  -ca CONNECTION_ALIAS, --connection-alias CONNECTION_ALIAS
                        alias of connection to benchmark
  -f CONFIG_FOLDER, --config-folder CONFIG_FOLDER
                        folder containing query and connection config files. If set, the names connections.config and queries.config are assumed automatically.
  -r RESULT_FOLDER, --result-folder RESULT_FOLDER
                        folder for storing benchmark result files, default is given by timestamp
  -e {no,yes}, --generate-evaluation {no,yes}
                        generate new evaluation file
  -w {query,connection}, --working {query,connection}
                        working per query or connection
  -p NUMPROCESSES, --numProcesses NUMPROCESSES
                        Number of parallel client processes. Global setting, can be overwritten by connection. If None given, half of all available processes is taken
  -s SEED, --seed SEED  random seed
  -cs, --copy-subfolder
                        copy subfolder of result folder
  -ms MAX_SUBFOLDERS, --max-subfolders MAX_SUBFOLDERS
                        maximum number of subfolders of result folder
  -sl SLEEP, --sleep SLEEP
                        sleep SLEEP seconds before going to work
  -st START_TIME, --start-time START_TIME
                        sleep until START-TIME before beginning benchmarking
  -sf SUBFOLDER, --subfolder SUBFOLDER
                        stores results in a SUBFOLDER of the result folder
  -vq, --verbose-queries
                        print every query that is sent
  -vs, --verbose-statistics
                        print statistics about query that have been sent
  -vr, --verbose-results
                        print result sets of every query that have been sent
  -vp, --verbose-process
                        print result sets of every query that have been sent
  -pn NUM_RUN, --num-run NUM_RUN
                        Parameter: Number of executions per query
  -m, --metrics         collect hardware metrics per query
  -mps, --metrics-per-stream
                        collect hardware metrics per stream
Result folder
This optional argument is the name of a folder.
If this folder contains results, results saved inside can be read or benchmarks saved there can be continued.
Example: -r /tmp/dbmsresults/1234/ contains benchmarks of code 1234.
If this folder does not contain results, a new subfolder is generated.
It’s name is set automatically to some number derived from current timestamp.
Results and reports are stored there.
Input files for connections and queries are copied to this folder.
Example: -r /tmp/dbmsresults/, and a subfolder, say 1234, will be generated containing results.
Config folder
Name of folder containing query and connection config files.
If set, the names connections.config and queries.config are assumed automatically.
Connection File
Contains infos about JDBC connections.
Example for CONNECTION_FILE:
[
  {
    'name': "MySQL",
    'version': "CE 8.0.13",
    'info': "This uses engine innodb",
    'active': True,
    'alias': "DBMS A",
    'docker': "MySQL",
    'docker_alias': "DBMS A",
    'dialect': "MySQL",
    'timeload': 100,
    'priceperhourdollar': 1.0,
    'JDBC': {
      'driver': "com.mysql.cj.jdbc.Driver",
      'url': "jdbc:mysql://localhost:3306/database",
      'auth': ["username", "password"],
      'jar': "mysql-connector-java-8.0.13.jar"
    },
    'connectionmanagement': {
      'timeout': 600,
      'numProcesses': 4,
      'runsPerConnection': 5
    },
    'hostsystem': {
      'RAM': 61.0,
      'CPU': 'Intel(R) Xeon(R) CPU E5-2686 v4 @ 2.30GHz\n',
      'Cores': '8\n',
      'host': '4.4.0-1075-aws\n',
      'disk': '82G\n',
      'CUDA': ' NVIDIA-SMI 410.79       Driver Version: 410.79       CUDA Version: 10.0',
      'instance': 'p3.2xlarge'
    },
    'monitoring': {
      'shift': 0,
      'extend': 20,
      'prometheus_url': 'http://127.0.0.1:9090/api/v1/',
      'metrics': {
        'total_cpu_memory': {
          'query': 'container_memory_working_set_bytes{job="monitor-node"}/1024/1024',
          'title': 'CPU Memory [MiB]'
        }
      }
    }
},
]
name: References the connectionversionandinfo: Just info texts for implementation in reportsactive: Use this connection in benchmarking and reporting (optional, default True)alias: Alias for anonymized reports (optional, default is a random name)docker: Name of the docker image. This helps aggregating connections using the same docker image.docker_alias: Anonymized name of the docker image. This helps aggregating connections using the same docker image in anonymized reports.alias: Alias for anonymized reports (optional default is a random name)dialect: Key for (optional) alternative SQL statements in the query filedriver,url,auth,jar: JDBC dataAdditional information useful for reporting and also used for computations
timeload: Time for ingest (in milliseconds), because not part of the benchmarkpriceperhourdollar: Used to compute total cost based on total time (optional)
connectionmanagement: Parameter for connection management. This overwrites general settings made in the query config and can be overwritten by query-wise settings made there.timeout: Maximum lifespan of a connection. Default is None, i.e. no limit.numProcesses: Number of parallel client processes. Default is 1.runsPerConnection: Number of runs performed before connection is closed. Default is None, i.e. no limit.
hostsystem: Describing information for report in particular about the host system. This can be written automatically by https://github.com/Beuth-Erdelt/Benchmark-Experiment-Host-Managermonitoring: We might also add information about fetching monitoring metrics.prometheus_url: URL to API of Prometheus instance monitoring the system under testshift: Shifts the fetched interval bynseconds to the future.extend: Extends the fetched interval bynseconds at both ends.
Monitoring
The parameter --metrics can be used to activate fetching metrics from a Prometheus server.
In the connection.config we may insert a section per connection about where to fetch these metrics from and which metrics we want to obtain.
More information about monitoring and metrics can be found here: https://github.com/Beuth-Erdelt/Benchmark-Experiment-Host-Manager/blob/master/docs/Monitoring.html
The parameter --metrics-per-stream does the same, but collects the metrics per stream - not per query.
This is useful when queries are very fast.
Query File
Contains the queries to benchmark.
Example for QUERY_FILE:
{
  'name': 'Some simple queries',
  'intro': 'Some describing text about this benchmark test setup',
  'info': 'It runs on a P100 GPU',
  'factor': 'mean',
  'queries':
  [
    {
      'title': "Count all rows in test",
      'query': "SELECT COUNT(*) FROM test",
      'delay': 0,
      'numRun': 10,
    },
  ]
}
name: Name of the list of queriesintro: Introductional text for reportsinfo: Short info about the current experimentfactor: Determines the measure for comparing performances (optional). Can be set tomeanormedianorrelative. Default ismean.query: SQL query stringtitle: Title of the querydelay: Number of seconds to wait before each execution statement. This is for throtteling. Default is 0.numRun: Number of runs of this query for benchmarking
Such a query will be executed 10 times and the time of execution will be measured each time.
Extended Query File
Extended example for QUERY_FILE:
{
  'name': 'Some simple queries',
  'intro': 'This is an example workload',
  'info': 'It runs on a P100 GPU',
  'connectionmanagement': {
    'timeout': 600,
    'numProcesses': 4,
    'runsPerConnection': 5
  },
  'queries':
  [
    {
      'title': "Count all rows in test",
      'query': "SELECT COUNT(*) c FROM test",
      'DBMS': {
        'MySQL': "SELECT COUNT(*) AS c FROM test"
      }
      'delay': 1,
      'numRun': 10,
      'connectionmanagement': {
        'timeout': 100,
        'numProcesses': 1,
        'runsPerConnection': None
      },
      'timer':
      {
        'connection':
        {
          'active': True,
          'delay': 0
        },
        'datatransfer':
        {
          'active': True,
          'sorted': True,
          'compare': 'result',
          'store': 'dataframe',
          'precision': 4,
        }
      }
    },
  ]
}
SQL Dialects
The DBMS key allows to specify SQL dialects. All connections starting with the key in this dict with use the specified alternative query. In the example above, for instance a connection ‘MySQL-InnoDB’ will use the alternative.
Optionally at the definition of the connections an attribute dialect can be used. For example MemSQL may use the dialect MySQL.
Connection Management
The first connectionmanagement options set global values valid for all DBMS. This can be overwritten by the settings in the connection config. The second connectionmanagement is fixed valid for this particular query and cannot be overwritten.
timeout: Maximum lifespan of a connection. Default is None, i.e. no limit.numProcesses: Number of parallel client processes. Default is 1.runsPerConnection: Number of runs performed before connection is closed. Default is None, i.e. no limit.
Connection Latency
The connection timer will also measure the time for establishing a connection.
It is possible to force sleeping before each establishment by using delay (in seconds).
Default is 0.
Results and Comparison
The datatransfer timer will also measure the time for data transfer.
The tool can store retrieved data to compare different queries and dbms.
This helps to be sure different approaches yield the same results.
For example the query above should always return the same number of rows in table test.
compare can be used to compare result sets obtained from different runs and dbms.
compare is optional and can be
result: Compare complete result set. Every cell is trimmed. Floats can be rounded to a givenprecision(decimal places). This is important for example for comparing CPU and GPU based DBMS.hash: Compare hash value of result set.size: Compare size of result set.
If comparison detects any difference in result sets, a warning is generated.
The result set can optionally be sorted by each column before comparison by using sorted.
This helps avoid mismatch due to different orderings in the received sets.
Note that comparing result sets necessarily means they have to be stored, so result should only be used for small data sets. The parameter store commands the tool to keep the result set and is automatically set to True if any of the above is used. It can be set to False to command the tool to fetch the result set and immediately forget it. This helps measuring the time for data transfer without having to store all result sets, which in particular for large result sets and numbers of runs can exhauste the RAM.
Setting store can also yield the result sets to be stored in extra files. Possible values are: 'store': ['dataframe', 'csv']
Randomized Query File
Example for QUERY_FILE with randomized parameters:
{
  'name': 'Some simple queries',
  'defaultParameters': {'SF': '10'},
  'queries':
  [
    {
      'title': "Count rows in test",
      'query': "SELECT COUNT(*) FROM test WHERE name = {NAME}",
      'parameter': {
        'NAME': {
          'type': "list",
          'size': 1,
          'range': ["AUTOMOBILE","BUILDING","FURNITURE","MACHINERY","HOUSEHOLD"]
        }
      },
      'numWarmup': 5,
      'numRun': 10,
    },
  ]
}
A parameter contain of a name NAME, a range (list), a size(optional, default 1) and a type, which can be
list: list of values - random elementinteger: 2 integers - random value in betweenfloat: 2 floats - random value in betweendate: 2 dates in format ‘YYYY-mm-dd’ - random date in betweenfirstofmonth: 2 dates in format ‘YYYY-mm-dd’ - first of random month in betweenyear: 2 years as integers - random year in betweenhexcode: 2 integers - random value in between as hexcode
For each benchmark run, {NAME} is replaced by a (uniformly) randomly chosen value in the range and type given above.
By size we can specify the size of the sample (without replacement).
If set, each generated value will receive a {NAME} concatenated with the number of the sample.
Python3’s format() is used for replacement.
The values are generated once per query.
This means if a query is rerun or run for different dbms, the same list of values is used.
Example:
'NAME': {
  'type': "integer",
  'range': [1,100]
},
in a query with numWarmup=5 and numRun=10 will generate a random list of 10 integers between 1 and 100.
Each time the benchmark for this query is done, the same 10 numbers are used.
'NAME': {
  'type': "integer",
  'size': 2,
  'range': [1,100]
},
in a query with numWarmup=5 and numRun=10 will generate a random list of 10 pairs of integers between 1 and 100.
These pairs will replace {NAME1} and {NAME2} in the query.
Both elements of each pair will be different from eachother.
Each time the benchmark for this query is done, the same 10 pairs are used.
defaultParameters can be used to set parameters that hold for the complete workload.
Query List
Example for QUERY_FILE with a query that is a sequence:
{
  'name': 'Some simple queries',
  'queries':
  [
    {
      'title': "Sequence",
      'queryList': [2,3,4,5],
      'connectionmanagement': {
        'timeout': 600,
        'numProcesses': 1,
        'runsPerConnection': 4
      },
      'numRun': 12,
    },
  ]
}
This query does not have a query attribute, but an attribute queryList.
It is a list of other queries, here number 2, 3, 4 and 5.
The 12 benchmark runs are done by running these four queries one after the other, three times in total.
Here, we reconnect each time the sequence is through (runsPerConnection = 4) and we simulate one parallel client (numProcesses = 1).
This also respects randomization, i.e. every DBMS receives exactly the same versions of the queries in the same order.
Query
This parameter sets reading or running benchmarks to one fixed query.
For mode=run this means the fixed query is benchmarked (again), no matter if benchmarks already exist for this query.
For mode=continue this means missing benchmarks are performed for this fixed query only.
Queries are numbered starting at 1.
Connection
This parameter sets running benchmarks to one fixed DBMS (connection).
For mode=run this means the fixed DBMS is benchmarked (again), no matter if benchmarks already exist for it.
For mode=continue this means missing benchmarks are performed for this fixed DBMS only.
Connections are called by name.
Generate evaluation
If set to yes, an evaluation file is generated. This is a JSON file containing most of the evaluations. It can be accessed most easily using the inspection class or the interactive dashboard.
Debug
This flag activates output of debug infos.
Sleep
Time in seconds to wait before starting to operate. This is handy when we want to wait for other systems (e.g. a DBMS) to startup completely.
Batch
This flag changes the output slightly and should be used for logging if script runs in background. This also means reports are generated only at the end of processing. Batch mode is automatically turned on if debug mode is used.
Verbosity Level
Using the flags -vq means each query that is sent is dumped to stdout.
Using the flags -vr means each result set that is received is dumped to stdout.
Using the flags -vp means more information about the process and connections are dumped to stdout.
Using the flags -vs means after each query that has been finished, some statistics are dumped to stdout.
Working querywise or connectionswise
This options sets if benchmarks are performed per query (one after the other is completed) or per connection (one after the other is completed).
This means processing -w query is
loop over queries q
loop over connections c
making n benchmarks for q and c
compute statistics
save results
generate reports
and processing -w connection is
loop over connections c
loop over queries q
making n benchmarks for q and c
compute statistics
save results
generate reports
Client processes
This tool simulates parallel queries from several clients.
The option -p can be used to change the global setting for the number of parallel processes.
Moreover each connection can have a local values for this parameter.
If nothing is specified, the default value is used, which is half of the number of processors.
Random Seed
The option -s can be used to specify a random seed.
This should guarantee reproducible results for randomized queries.
Subfolders
If the flag --copy-subfolder is set, connection and query configuration will be copied from an existing result folder to a subfolder.
The name of the subfolder can be set via --subfolder.
These flags can be used to allow parallel quering of independent dbmsbenchmarker:
Each will write in an own subfolder.
These partial results can be merged using the merge.py command line tool.
The normal behaviour is: If we run the same connection twice, the results of the first run will be overwritten.
Since we might query the same connection in these instances, the subfolders will be numbered automatically.
Using MAX_SUBFOLDERS we can limit the number of subfolders that are allowed.
Example: -r /tmp/dbmsresults/1234/ -cs -sf MySQL will continue the benchmarks of folder /tmp/dbmsresults/1234/ by creating a folder /tmp/dbmsresults/1234/MySQL-1.
If that folder already exists, /tmp/dbmsresults/1234/MySQL-2 will be used etc.
This is in particular used by https://github.com/Beuth-Erdelt/Benchmark-Experiment-Host-Manager for jobs of parallel benchmarker.
Delay start
The parameter --sleep can be used to set a start time.
DBMSBenchmarker will wait until the given time is reached.
This is in particular used by https://github.com/Beuth-Erdelt/Benchmark-Experiment-Host-Manager for synching jobs of parallel benchmarker.
DBMS
In the following we list some minimal connection information that have been used in the past to connect to DBMS successfully.
Make sure to adjust the
URL of the server
localhostport of the server, when necessary
name of the database
database(and / orschema)username and passwort
user/passwordpath of the (locally existing) JDBC jar file - you will have to download the file from the website of the vendor
DB2
[
    {
        'name': 'DB2',
        'info': 'This is a demo of DB2',
        'active': True,
        'JDBC': {
            'driver': 'com.ibm.db2.jcc.DB2Driver',
            'url': 'jdbc:db2://localhost:50000/database:currentSchema=schema',
            'auth': ['user', 'password'],
            'jar': 'jars/db2jcc4.jar'
        }
    },
]
Exasol
[
    {
        'name': 'Exasol',
        'info': 'This is a demo of Exasol',
        'active': True,
        'JDBC': {
            'driver': 'com.exasol.jdbc.EXADriver',
            'url': 'jdbc:exa:localhost:8888;schema=schema',
            'auth': ['user', 'password'],
            'jar': 'jars/db2jcc4.jar'
        }
    },
]
Hyperscale (Citus)
[
    {
        'name': 'Citus',
        'info': 'This is a demo of Citus',
        'active': True,
        'JDBC': {
            'driver': 'org.postgresql.Driver',
            'url': 'jdbc:postgresql://localhost:5432/database',
            'auth': ['user', 'password'],
            'jar': 'jars/postgresql-42.2.5.jar'
        }
    },
]
MariaDB
[
    {
        'name': 'MariaDB',
        'info': 'This is a demo of MariaDB',
        'active': True,
        'JDBC': {
            'driver': 'org.mariadb.jdbc.Driver',
            'url': 'jdbc:mariadb://localhost:3306/database',
            'auth': ['user', 'password'],
            'jar': 'jars/mariadb-java-client-2.4.0.jar'
        }
    },
]
MonetDB
[
    {
        'name': 'MonetDB',
        'info': 'This is a demo of MonetDB',
        'active': True,
        'JDBC': {
            'driver': 'nl.cwi.monetdb.jdbc.MonetDriver',
            'url': 'jdbc:monetdb://localhost:50000/database?so_timeout=10000',
            'auth': ['user', 'password'],
            'jar': 'jars/monetdb-jdbc-2.29.jar',
        }
    },
]
MySQL
[
    {
        'name': 'MySQL',
        'info': 'This is a demo of MySQL',
        'active': True,
        'JDBC': {
            'driver': 'com.mysql.cj.jdbc.Driver',
            'url': 'jdbc:mysql://localhost:3306/database?serverTimezone=Europe/Berlin',
            'auth': ['user', 'password'],
            'jar': 'jars/mysql-connector-java-8.0.13.jar'
        },
    },
]
PostgreSQL
[
    {
        'name': 'PostgreSQL',
        'info': 'This is a demo of PostgreSQL',
        'active': True,
        'JDBC': {
            'driver': 'org.postgresql.Driver',
            'url': 'jdbc:postgresql://localhost:5432/database',
            'auth': ['user', 'password'],
            'jar': 'jars/postgresql-42.2.5.jar'
        }
    },
]
Evaluation
After an experiment has finished, the results can be evaluated. We show here some example evaluations to illustrate what is possible.
Example Evaluations
Some example evaluations
-
statistics - measures of tendency and dispersion, sensitive and insensitive to outliers
plots of times
box plots of times
summarizing and exhaustive latex reports containing further data like
precision and identity checks of result sets
an interactive inspection tool
a Latex report containing most of these
Informations about DBMS
The user has to provide in a config file
a unique name (connectionname)
JDBC connection information
If a monitoring interface is provided, hardware metrics are collected and aggregated. We may further provide describing information for reporting.
Global Metrics
Latency and Throughput
For each query, latency and throughput is computed per DBMS. This chart shows the geometric mean over all queries and per DBMS. Only successful queries and DBMS not producing any error are considered there.
Average Ranking
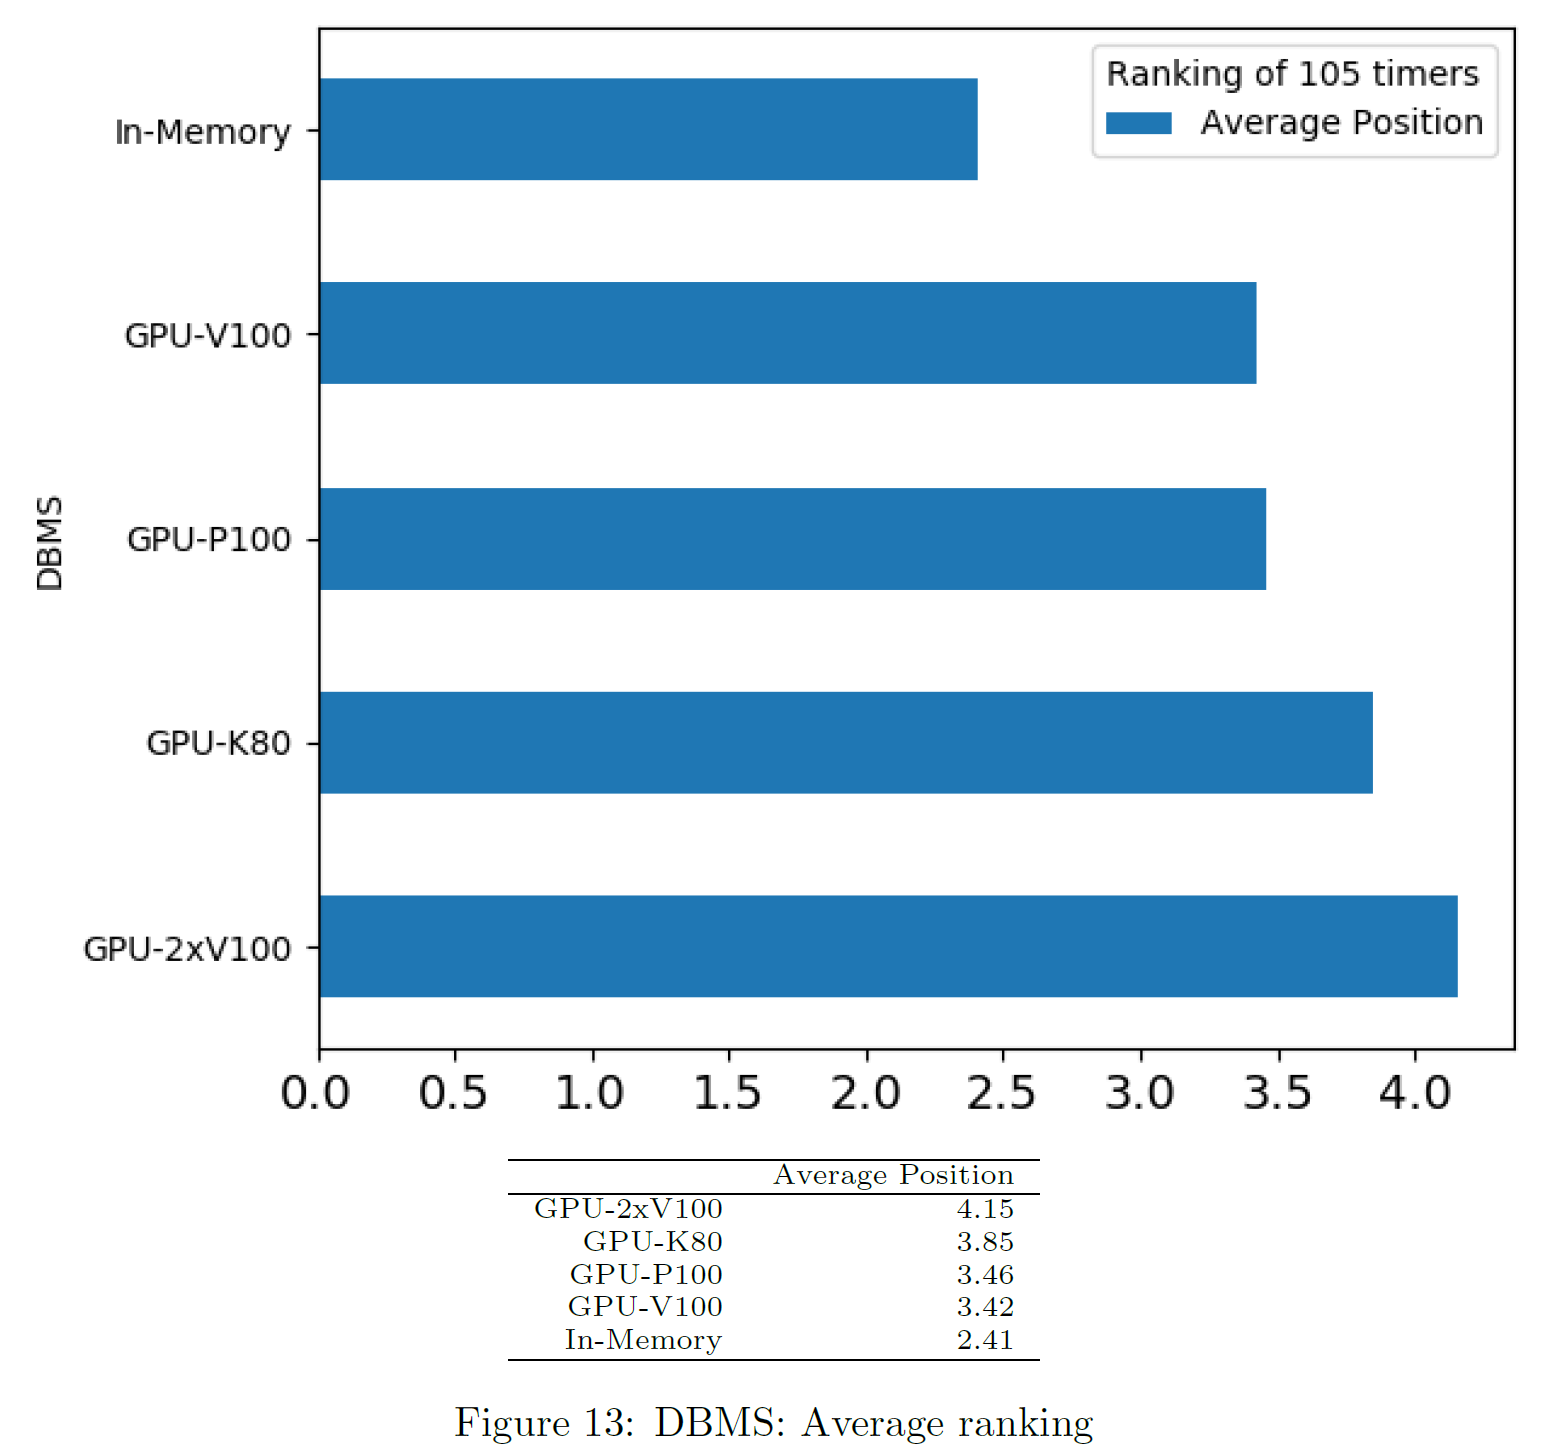
We compute a ranking of DBMS for each query based on the sum of times, from fastest to slowest. Unsuccessful DBMS are considered last place. The chart shows the average ranking per DBMS.
Time of Ingest per DBMS
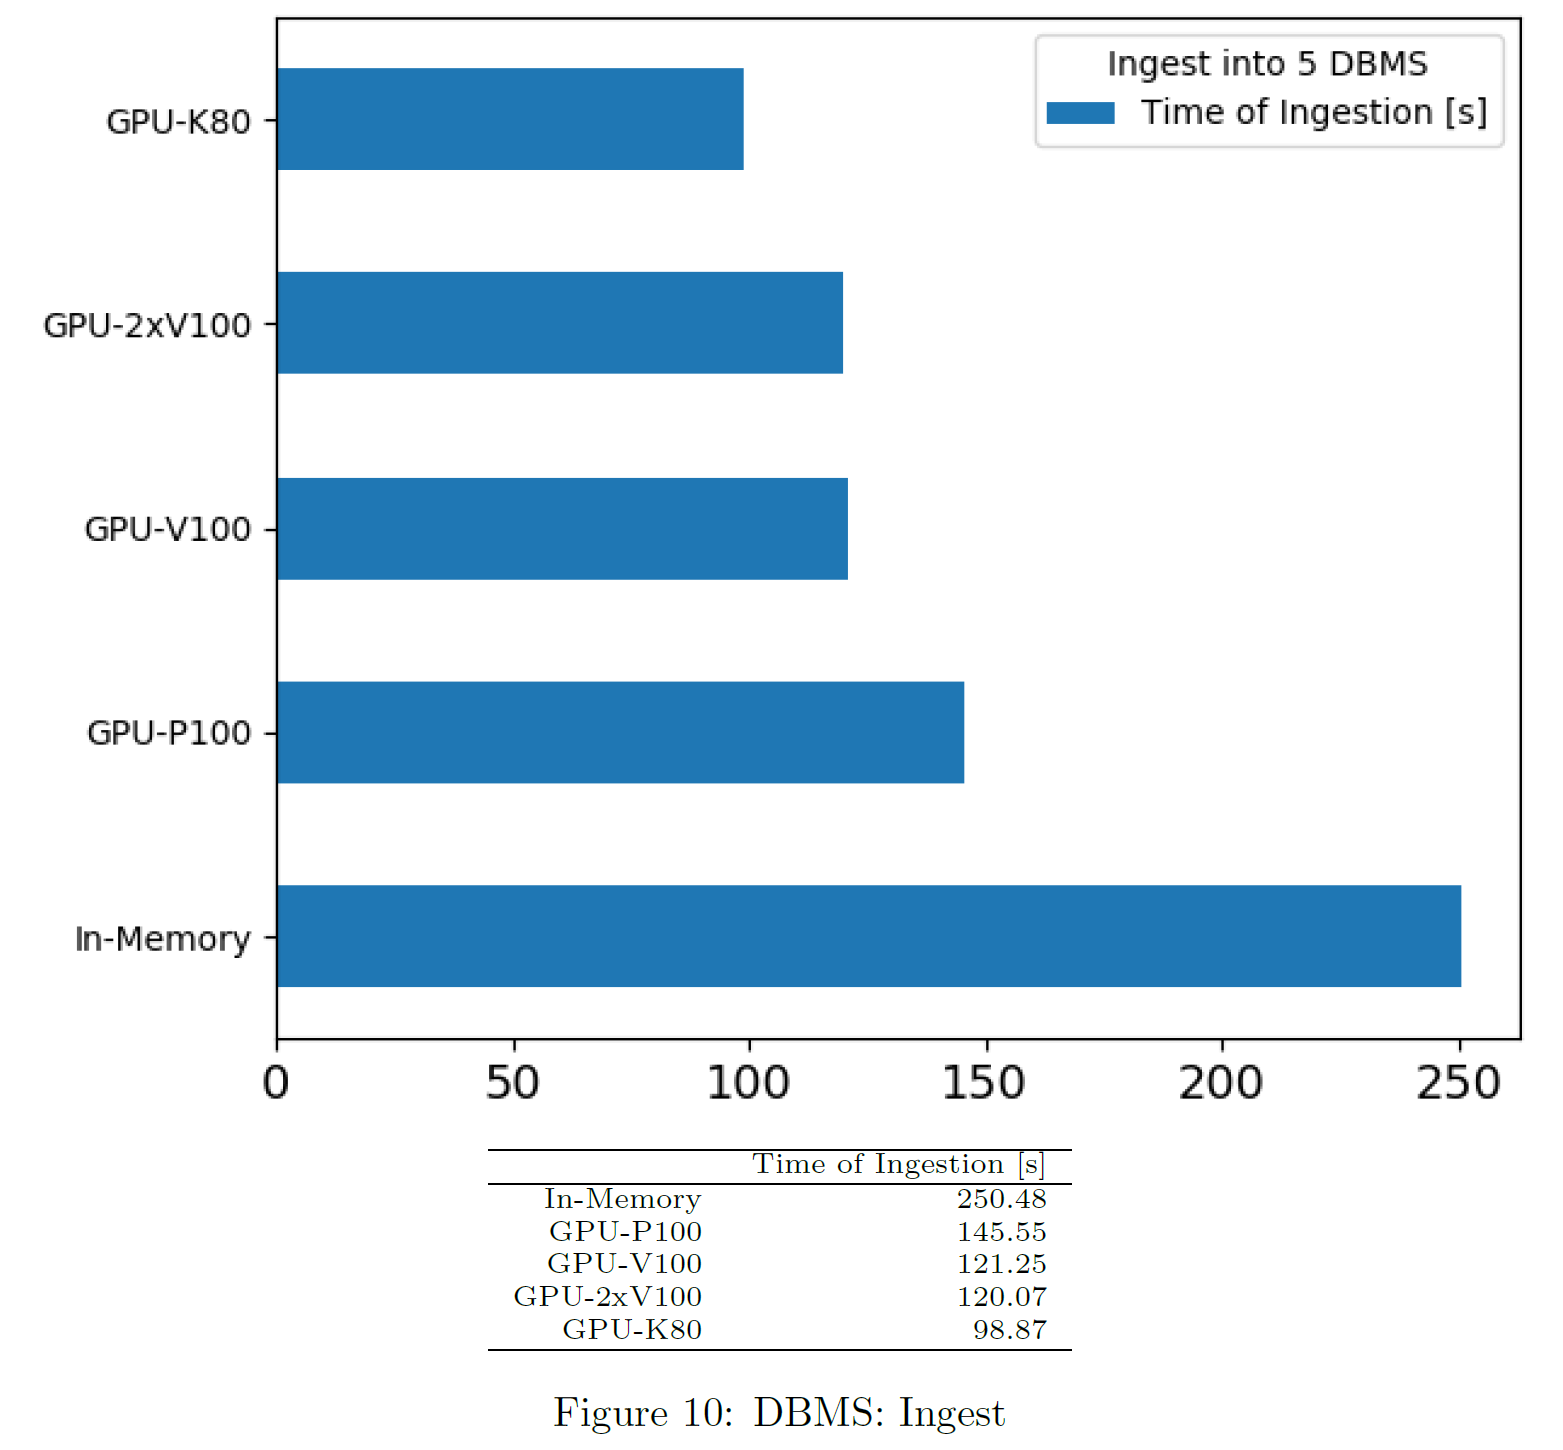
This is part of the informations provided by the user. The tool does not measure time of ingest explicitly.
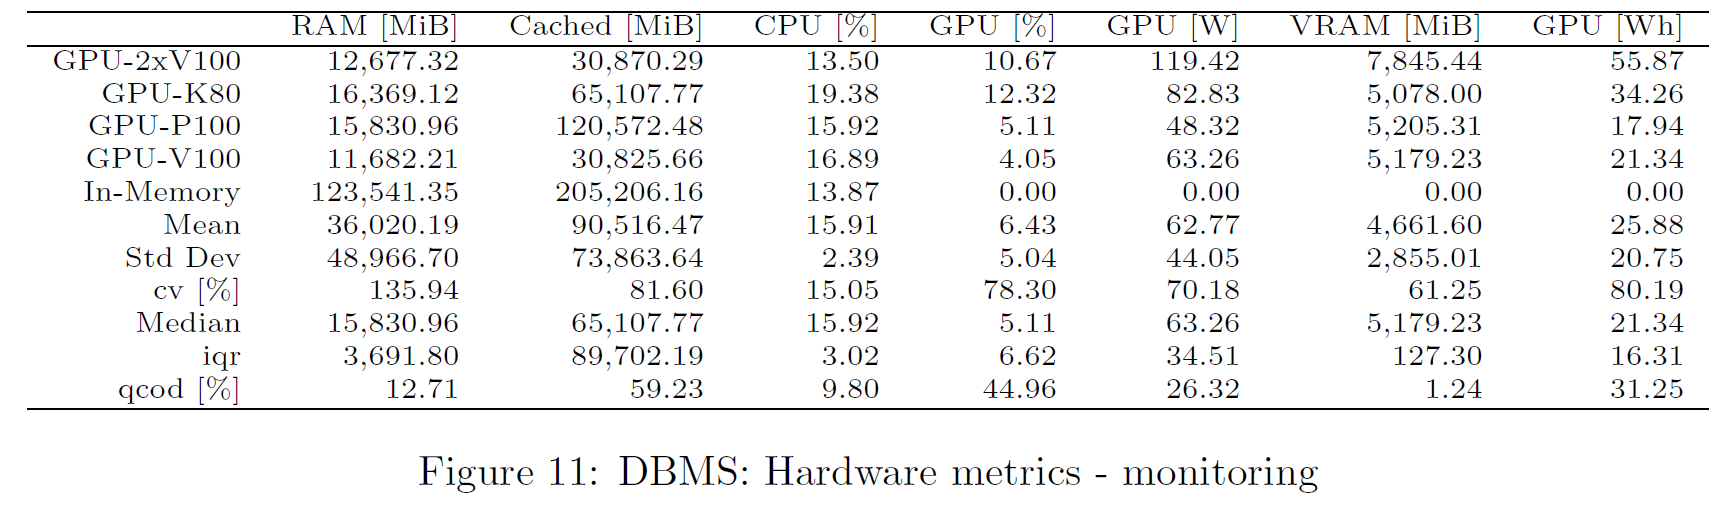
Hardware Metrics
The chart shows the metrics obtained from monitoring. Values are computed as arithmetic mean across benchmarking time. Only successful queries and DBMS not producing any error are considered.
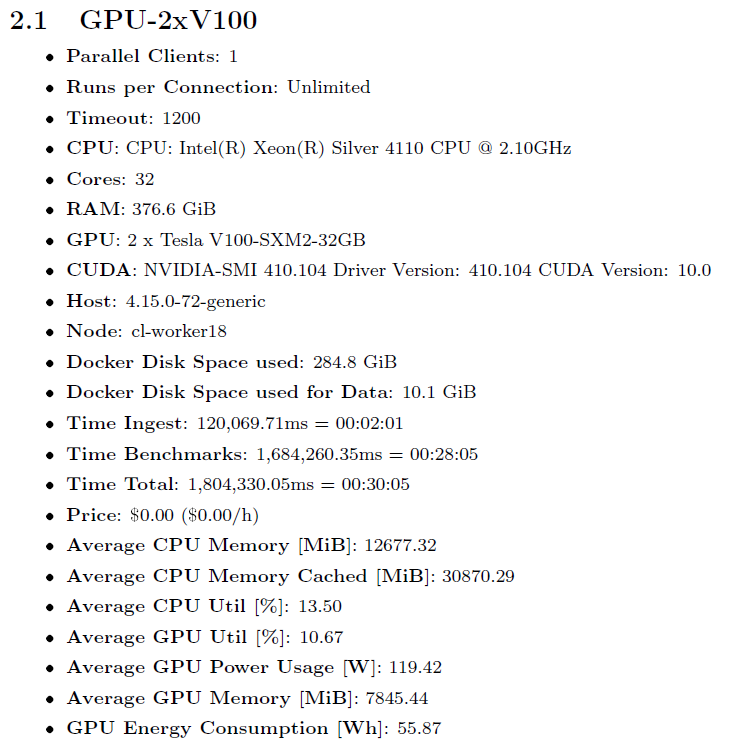
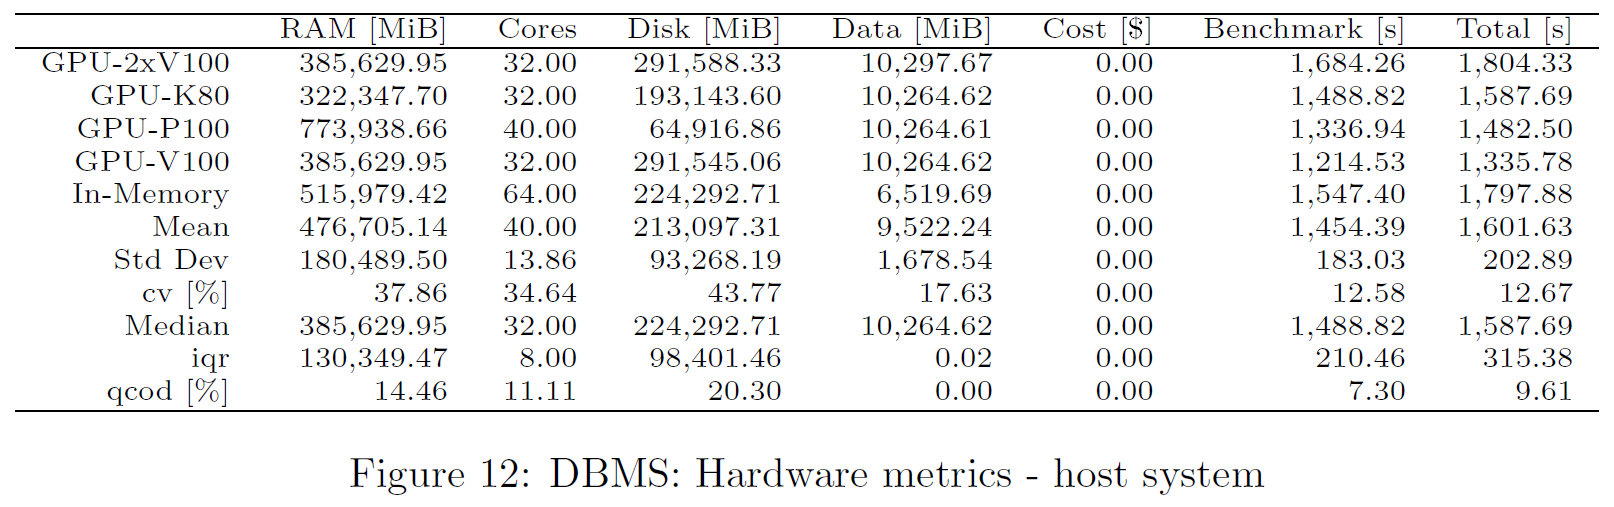
Host Metrics
The host information is provided in the config file. Here, cost is based on the total time.
Drill-Down Timers
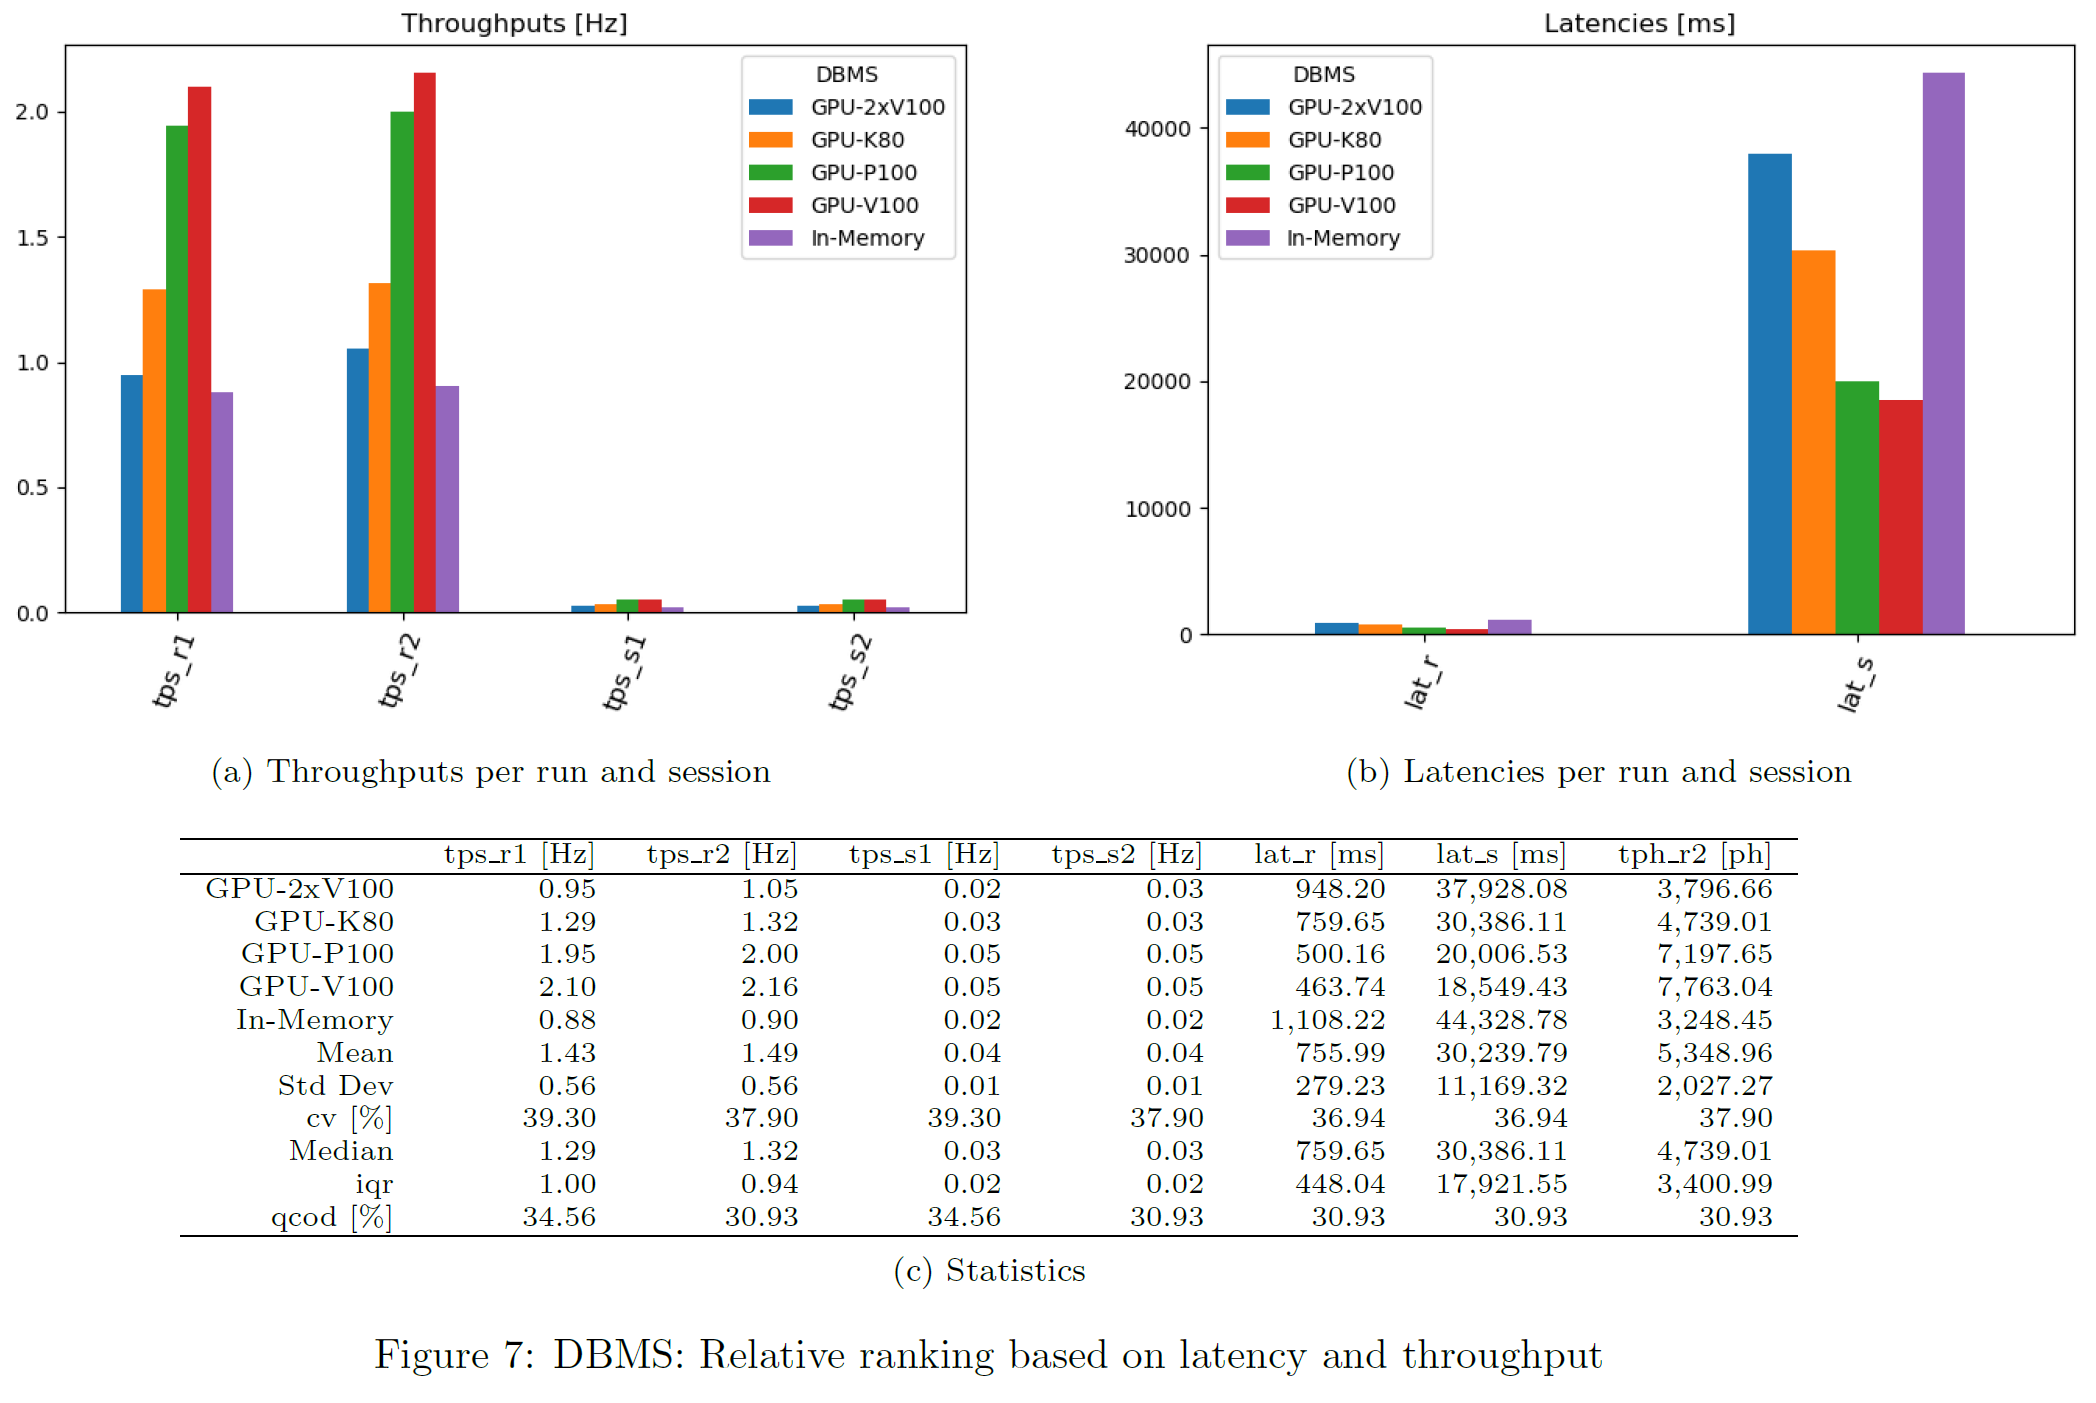
Relative Ranking based on Times
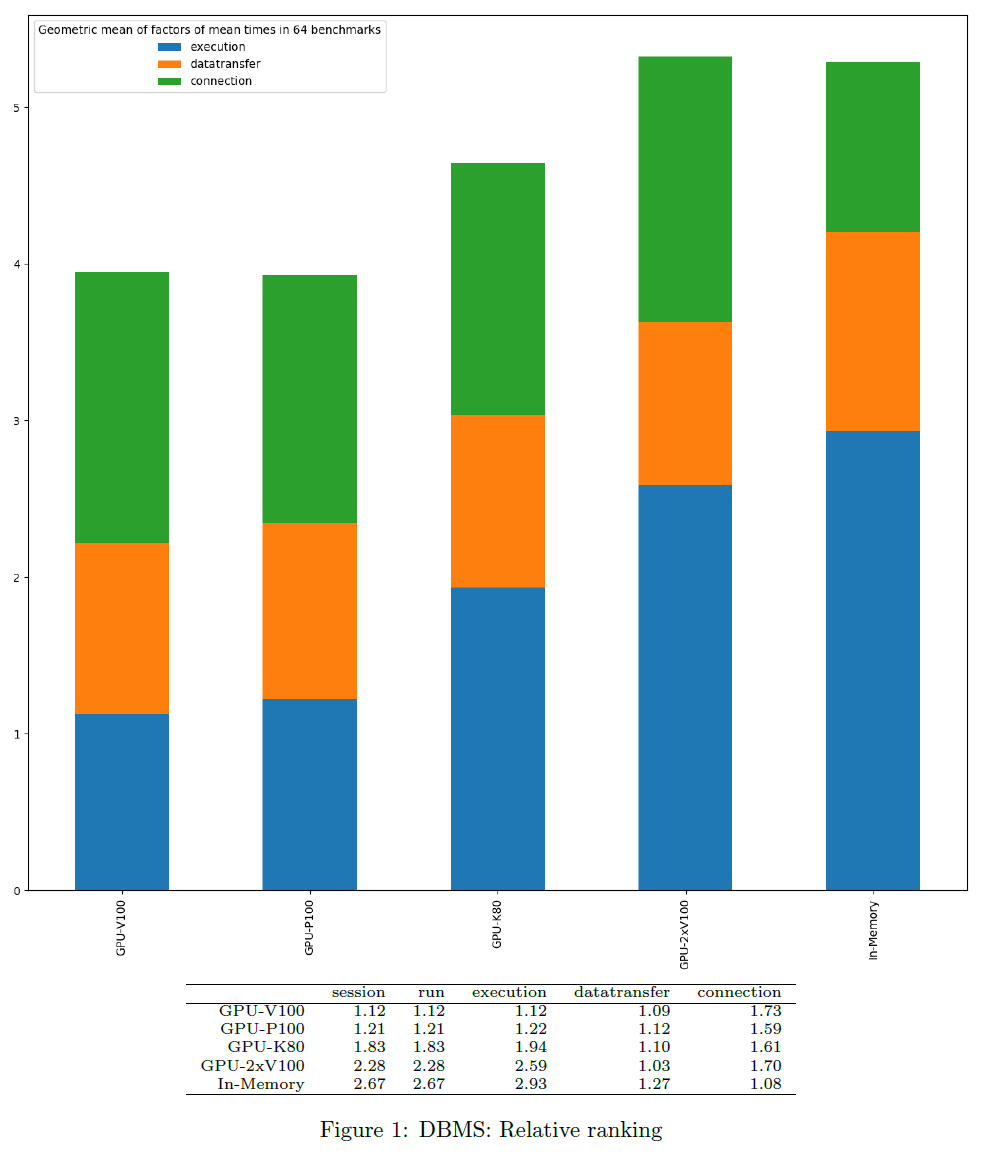
For each query and timer, the best DBMS is considered as gold standard = 100%. Based on their times, the other DBMS obtain a relative ranking factor. Only successful queries and DBMS not producing any error are considered. The chart shows the geometric mean of factors per DBMS.
Average Times
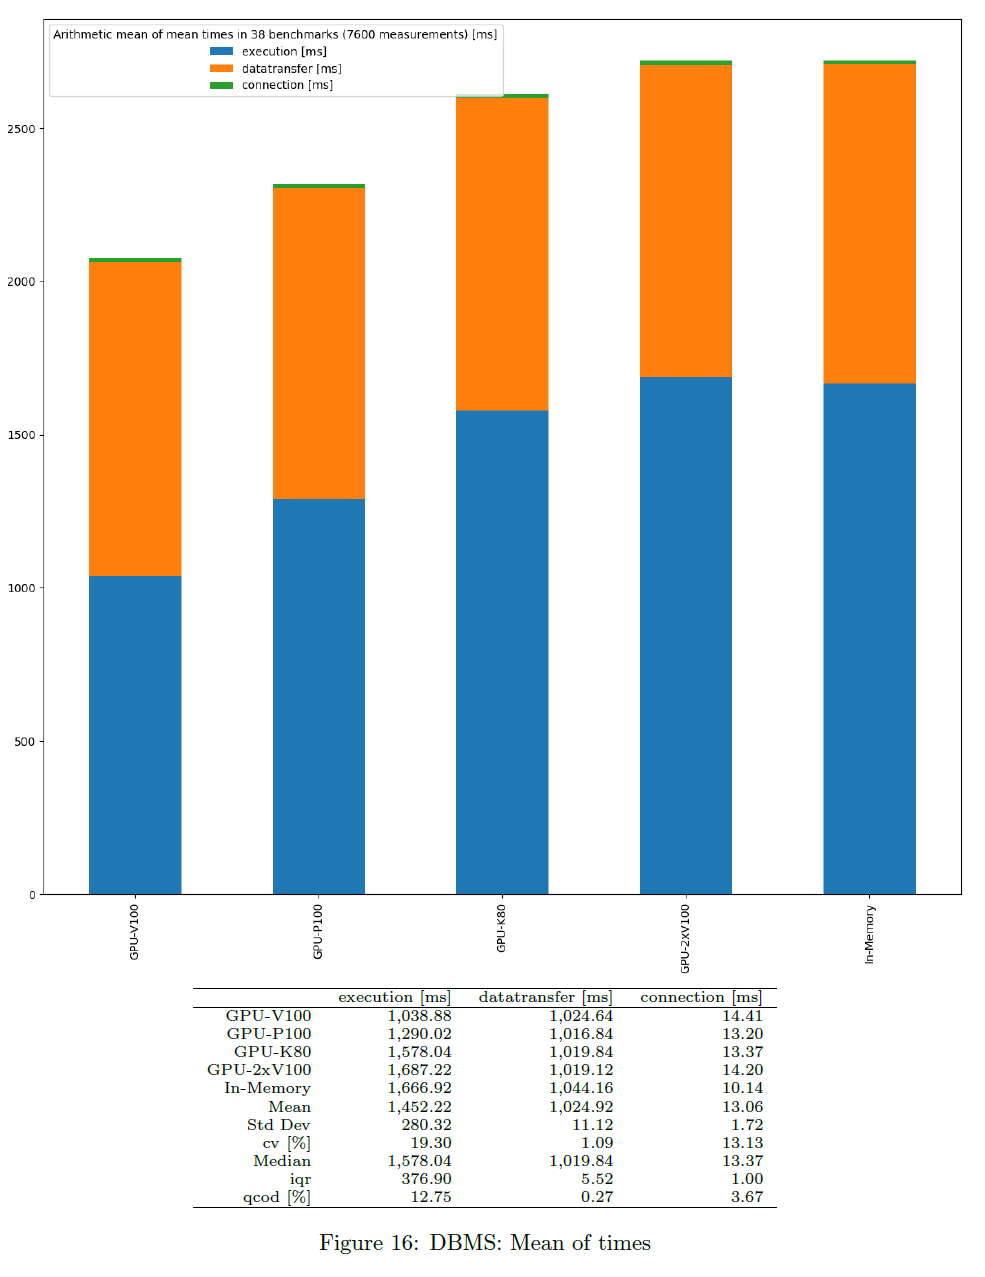
This is based on the mean times of all benchmark test runs. Measurements start before each benchmark run and stop after the same benchmark run has been finished. The average value is computed per query. Parallel benchmark runs should not slow down in an ideal situation. Only successful queries and DBMS not producing any error are considered. The chart shows the average of query times based on mean values per DBMS and per timer.
Note that the mean of mean values (here) is in general not the same as mean of all runs (different queries may have different number of runs).
Slice Timers
Heatmap of Factors
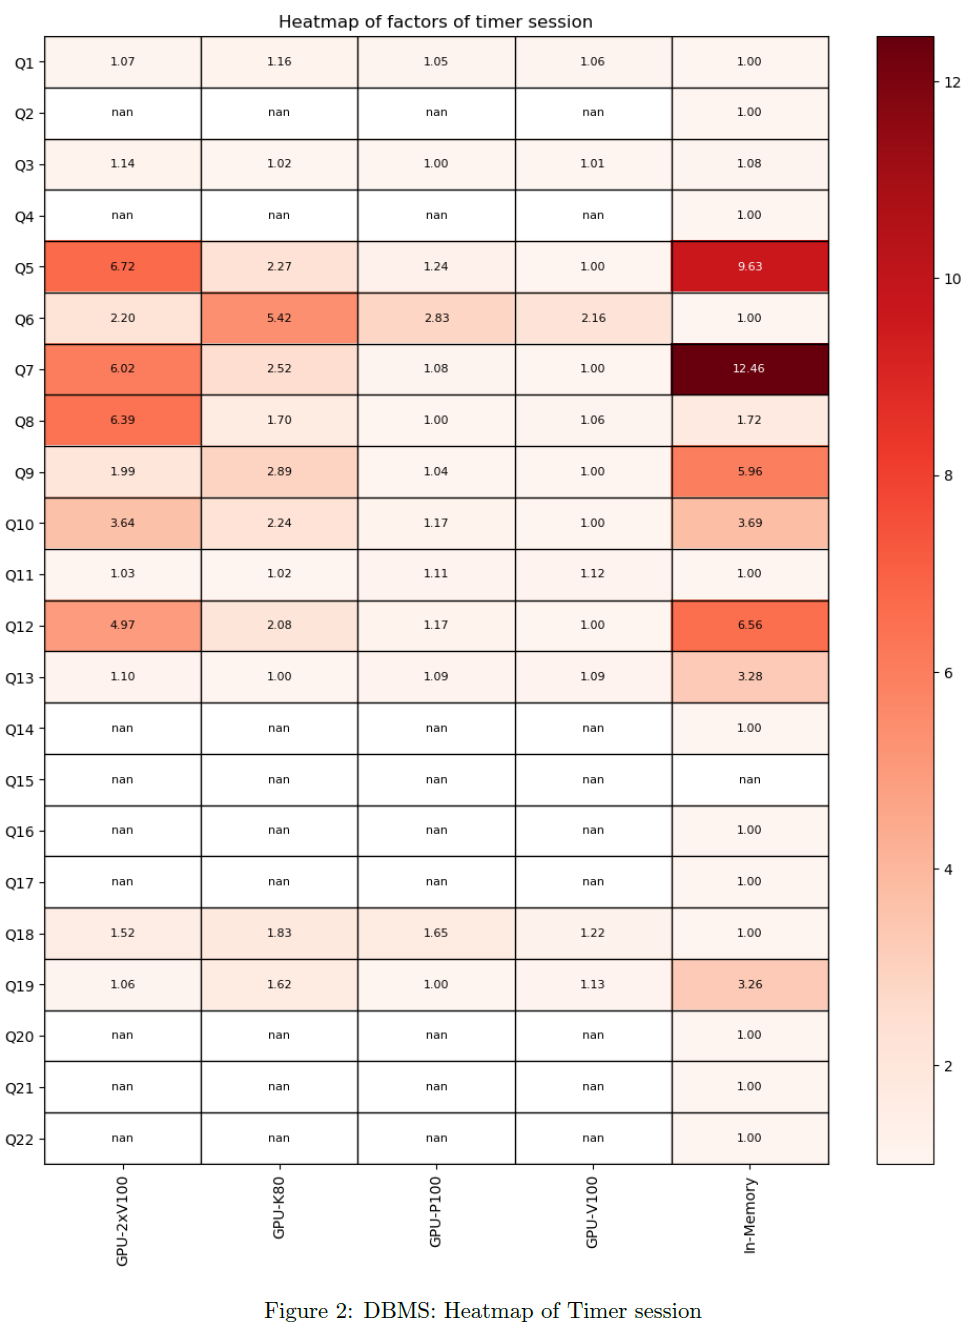
The relative ranking can be refined to see the contribution of each query. The chart shows the factor of the corresponding timer per query and DBMS. All active queries and DBMS are considered.
Drill-Down Queries
Total Times
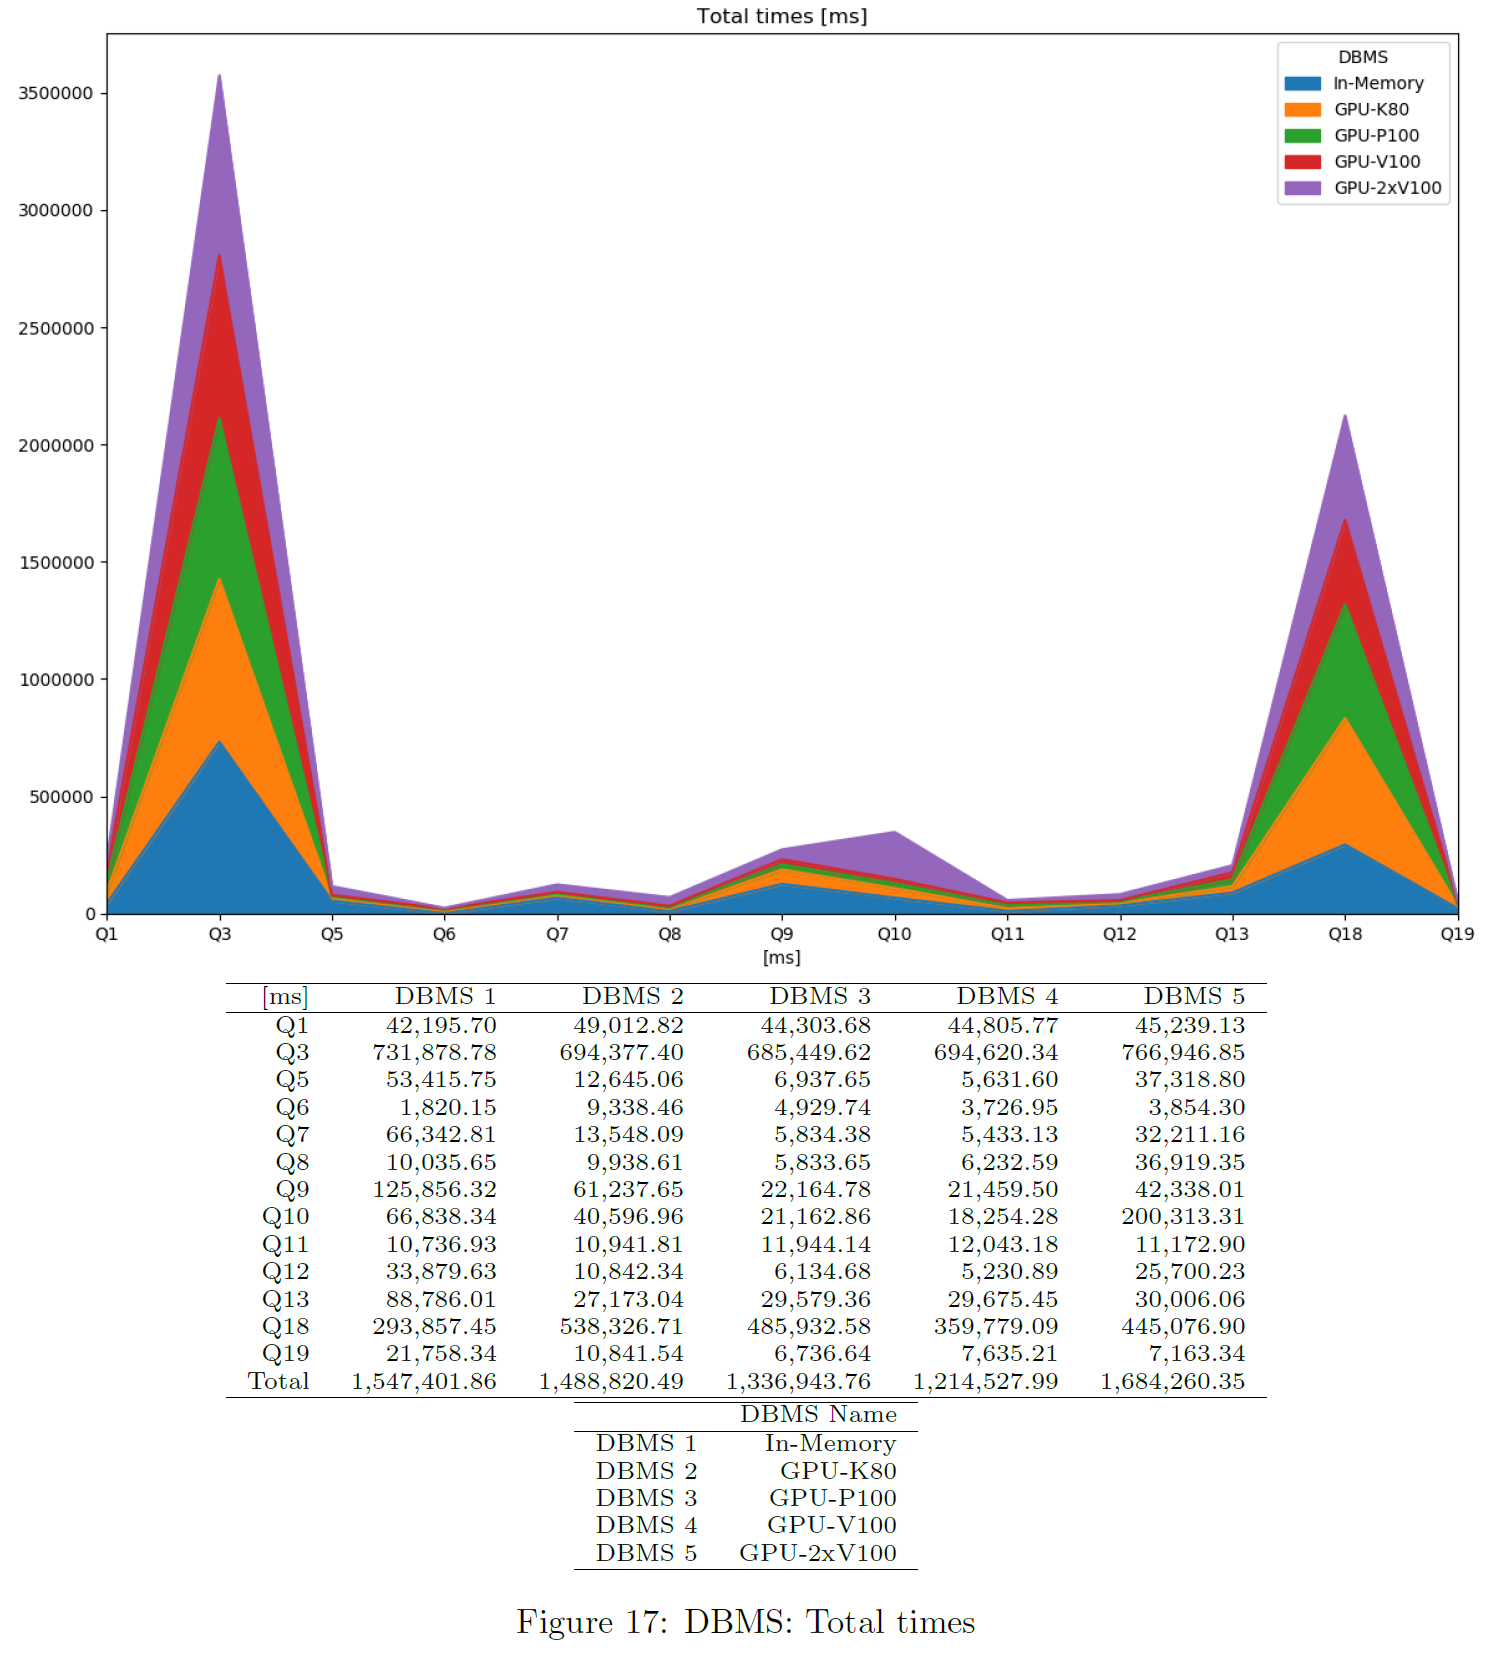
This is based on the times each DBMS is queried in total. Measurement starts before first benchmark run and stops after the last benchmark run has been finished. Parallel benchmarks should speed up the total time in an ideal situation. Only successful queries and DBMS not producing any error are considered. Note this also includes the time needed for sorting and storing result sets etc. The chart shows the total query time per DBMS and query.
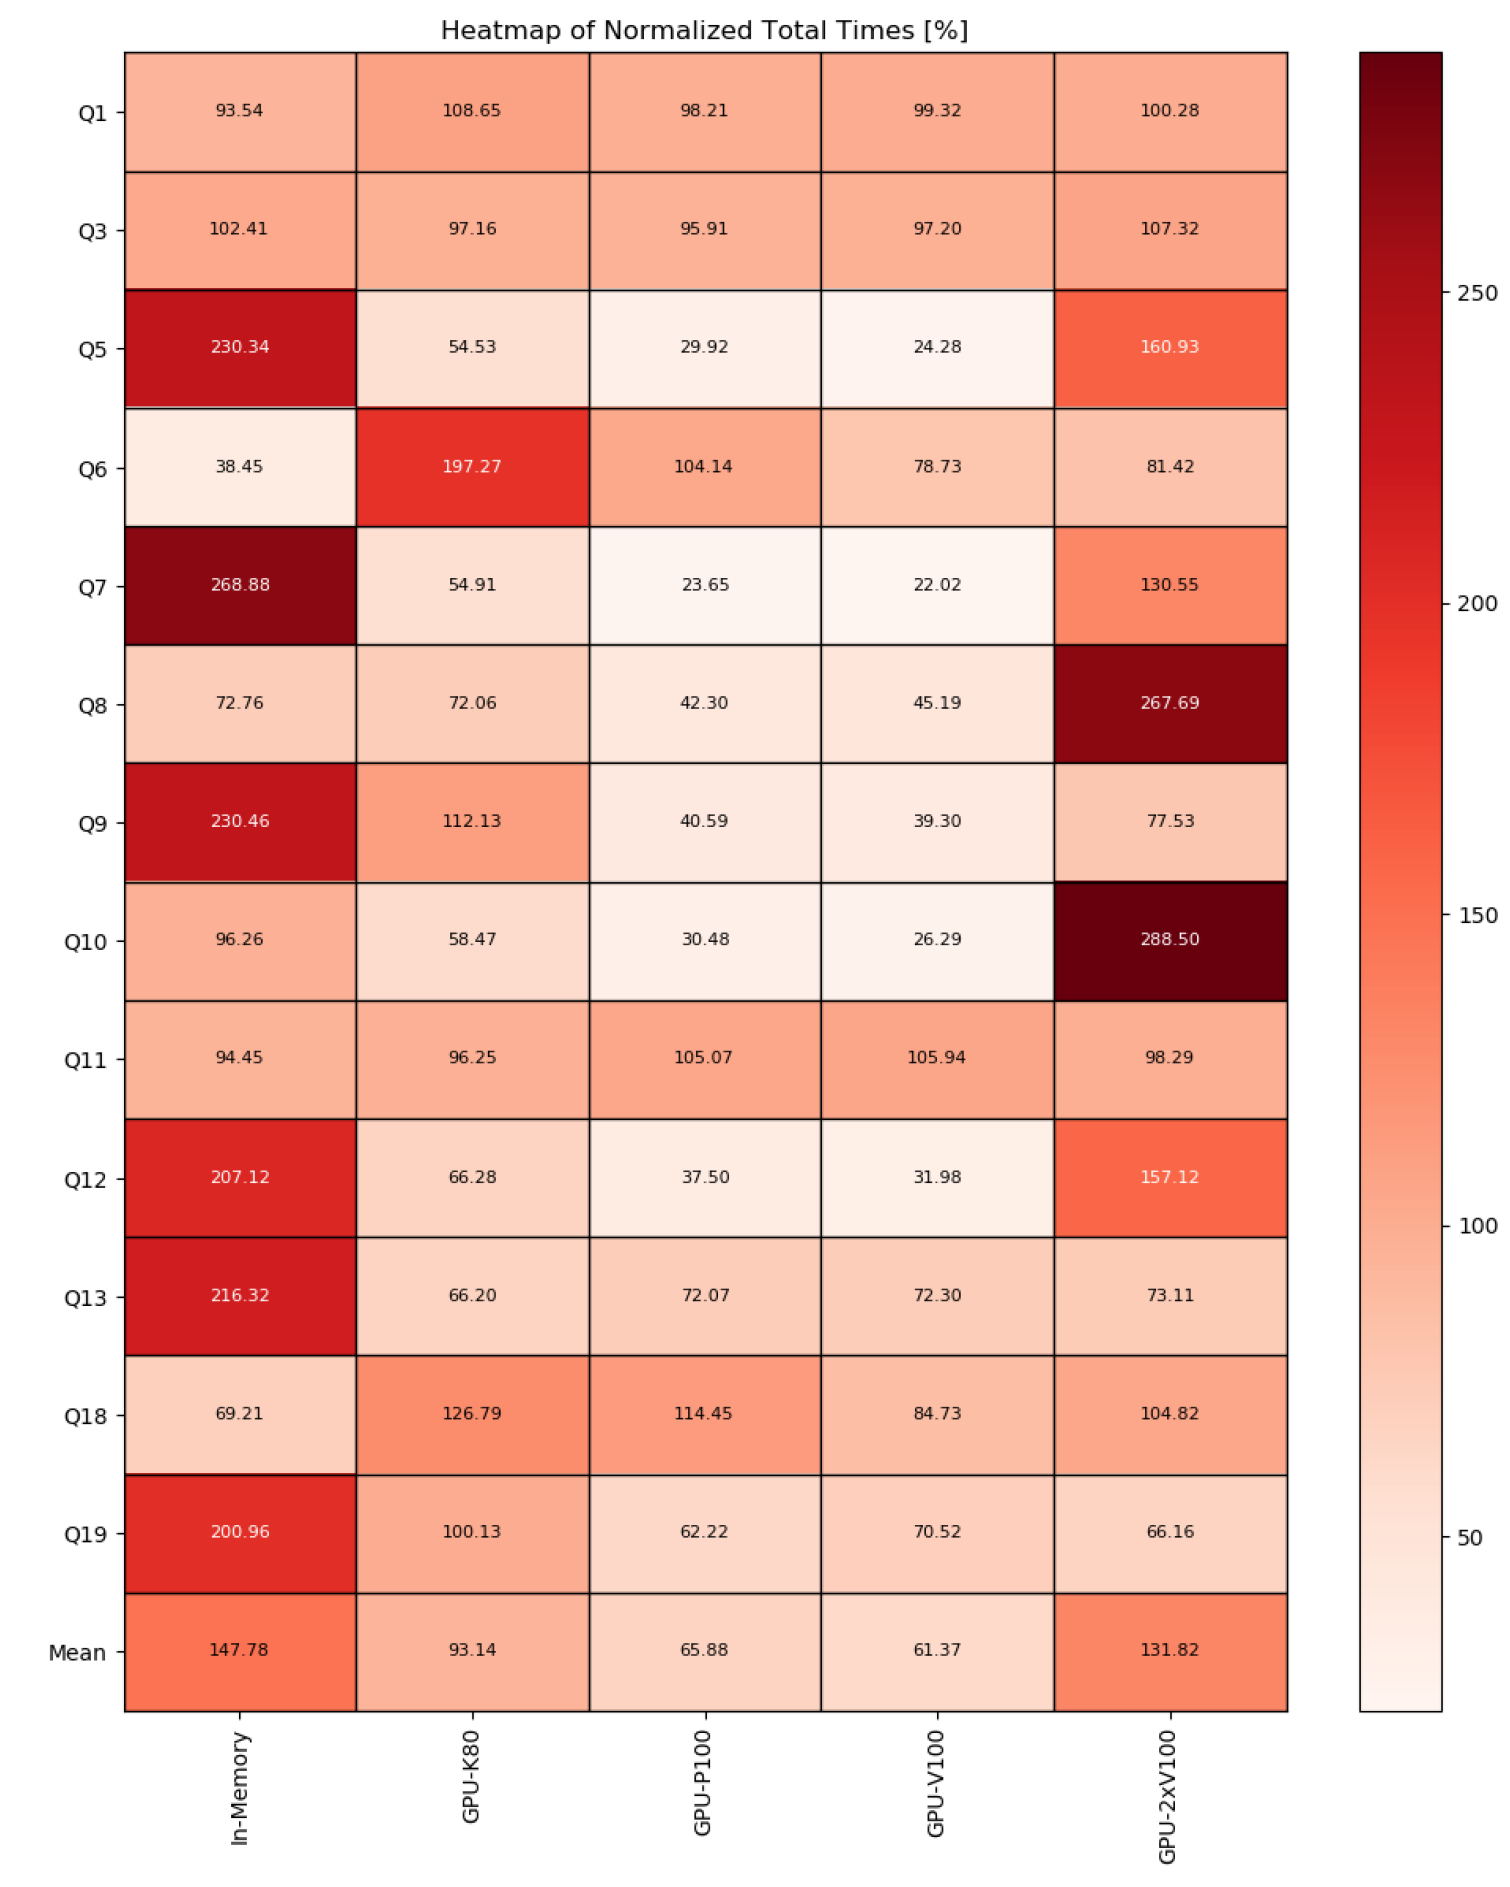
Normalized Total Times
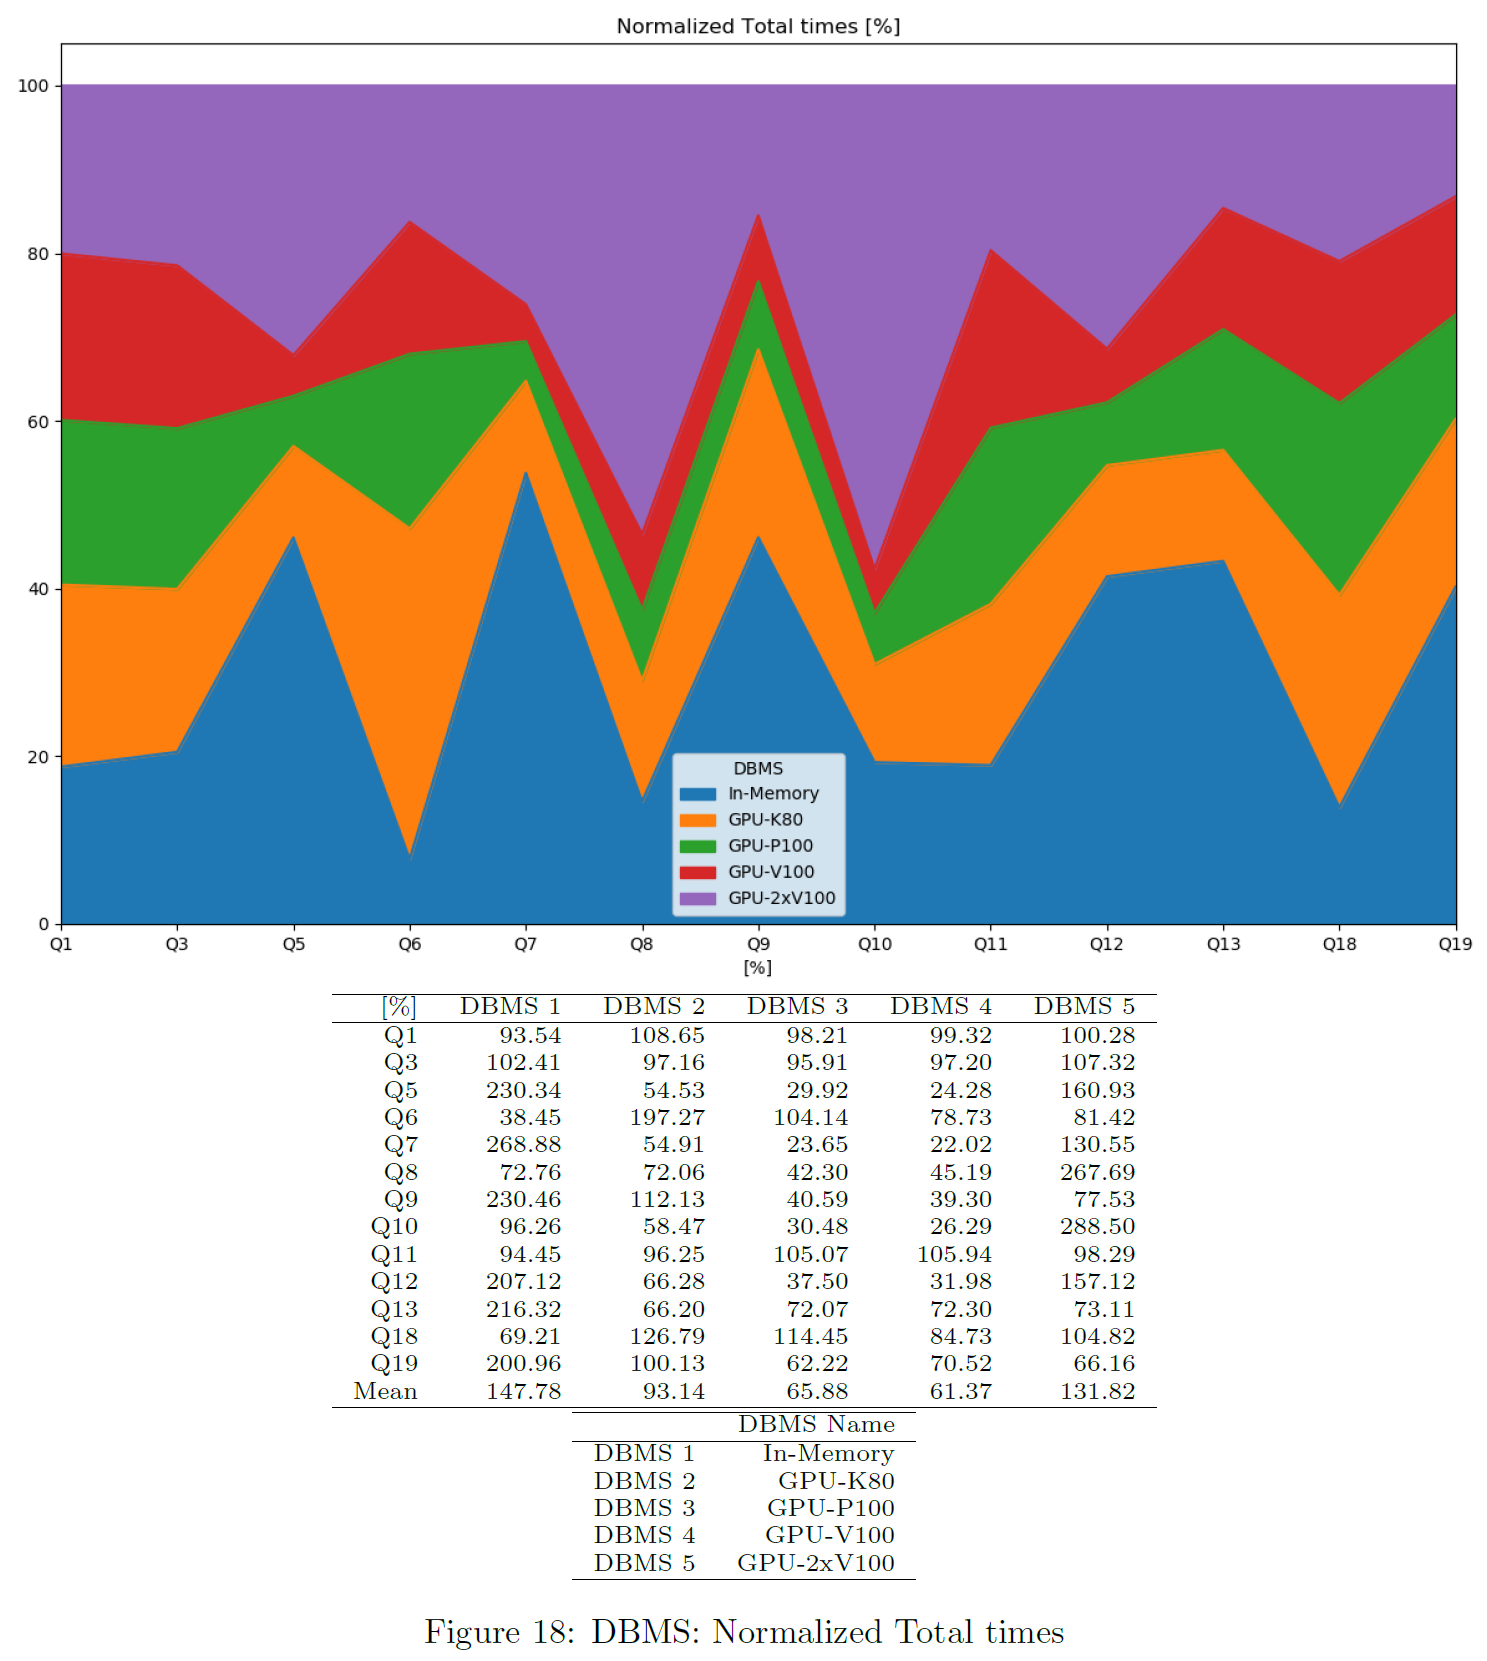
The chart shows total times per query, normalized to the average total time of that query. Only successful queries and DBMS not producing any error are considered. This is also available as a heatmap.
Throughputs
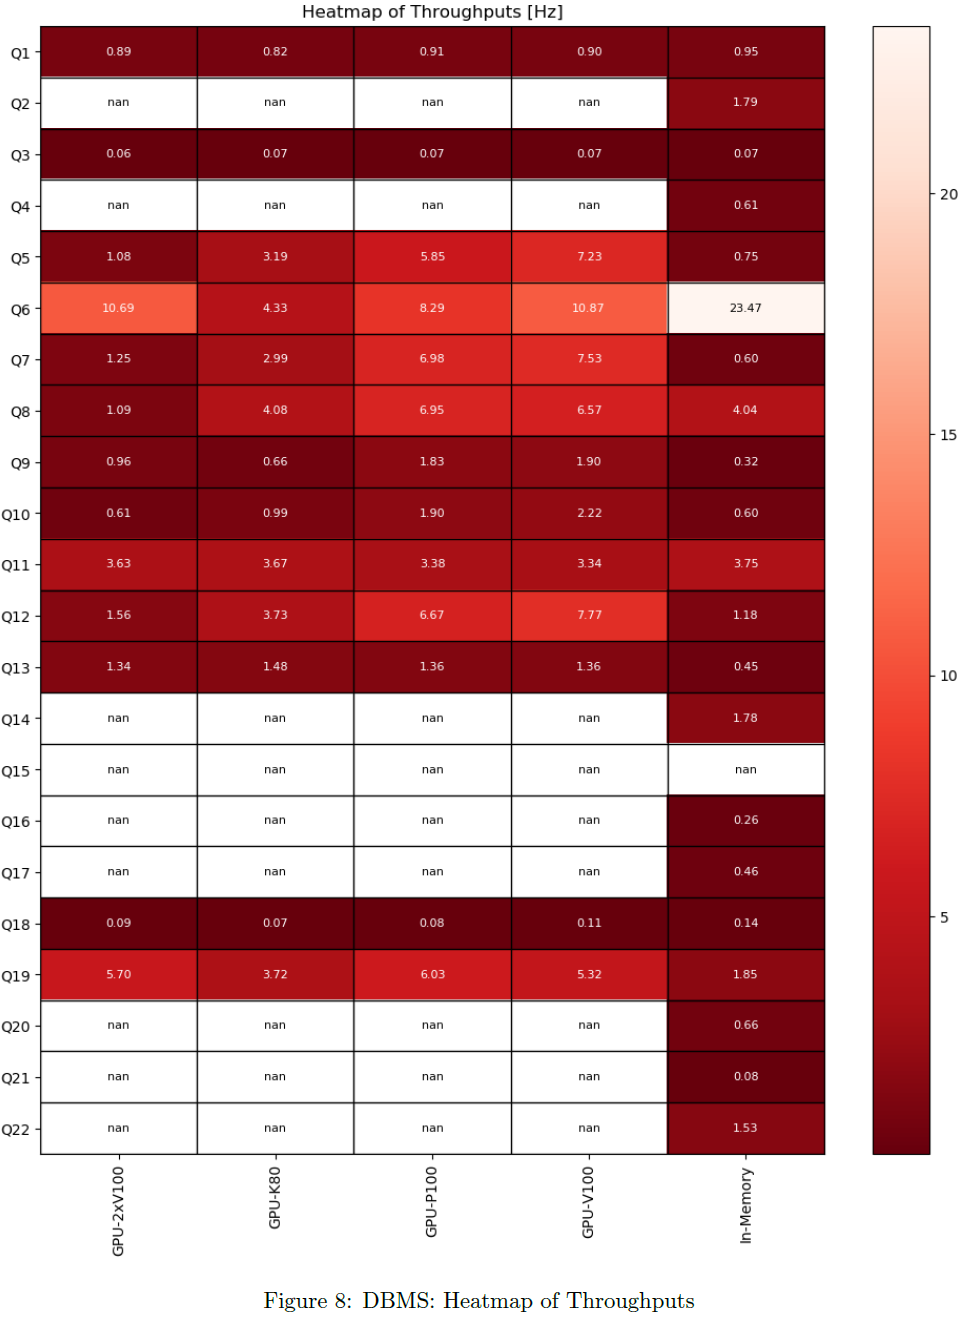
For each query, latency and throughput is computed per DBMS. Only successful queries and DBMS not producing any error are considered there.
Latencies
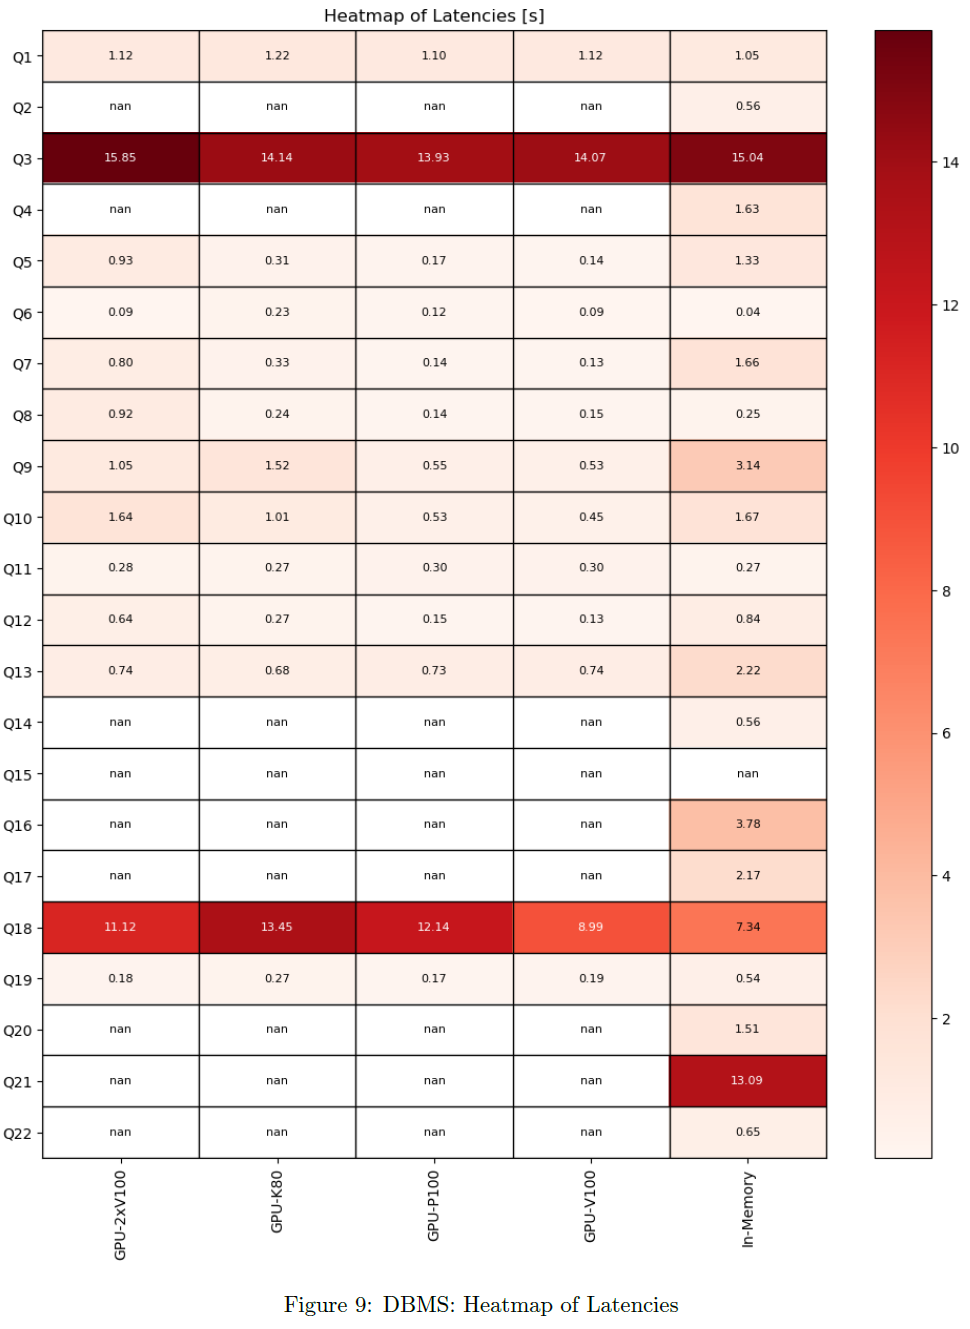
For each query, latency and throughput is computed per DBMS. Only successful queries and DBMS not producing any error are considered there.
Sizes of Result Sets
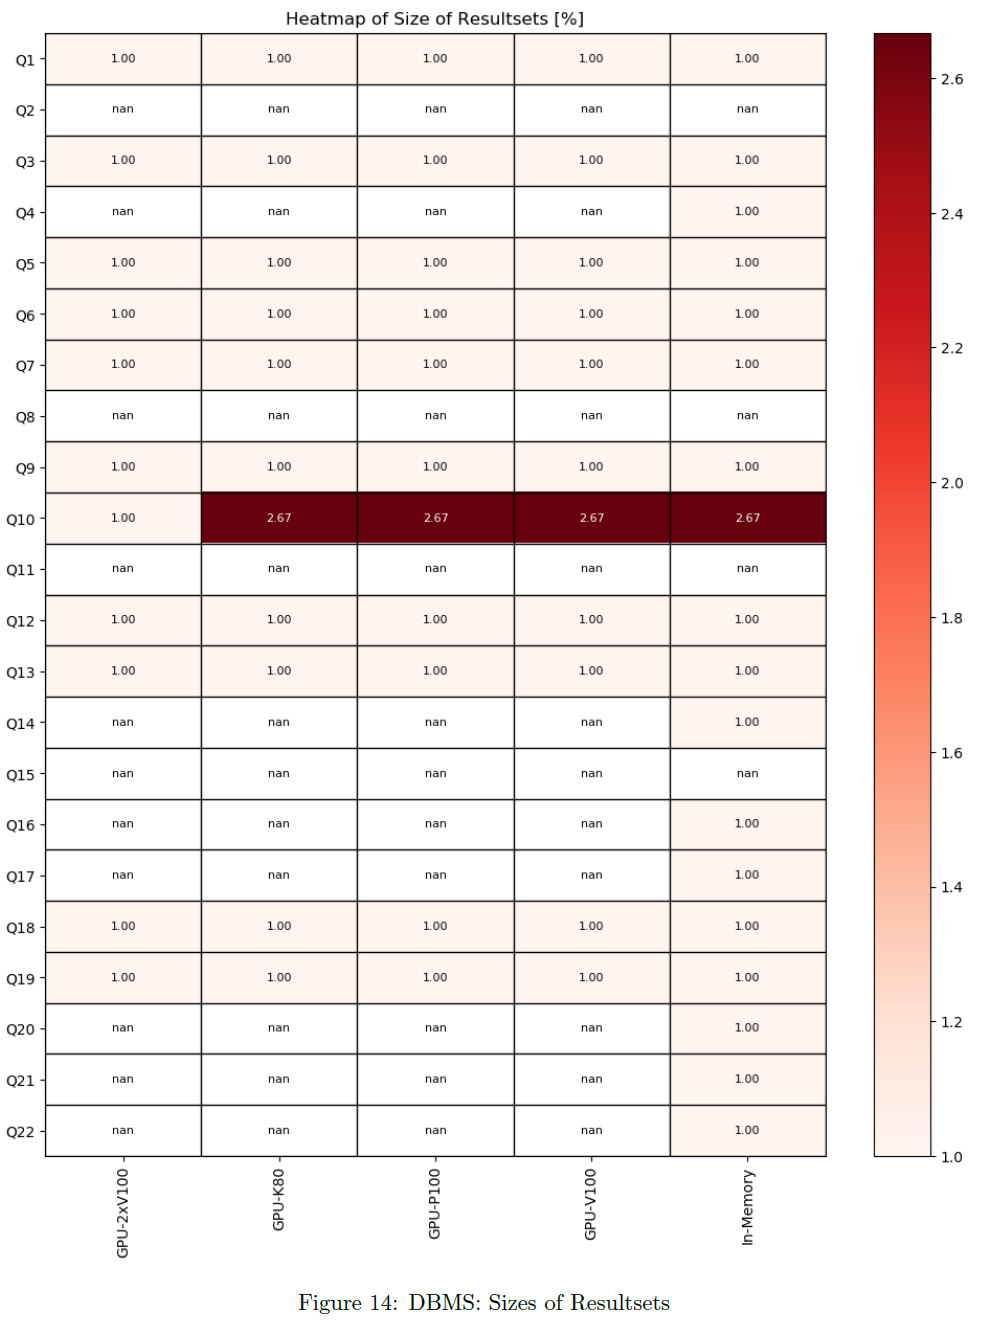
For each query, the size of received data per DBMS is stored. The chart shows the size of result sets per DBMS and per timer. Sizes are normalized to minimum per query. All active queries and DBMS are considered.
Errors
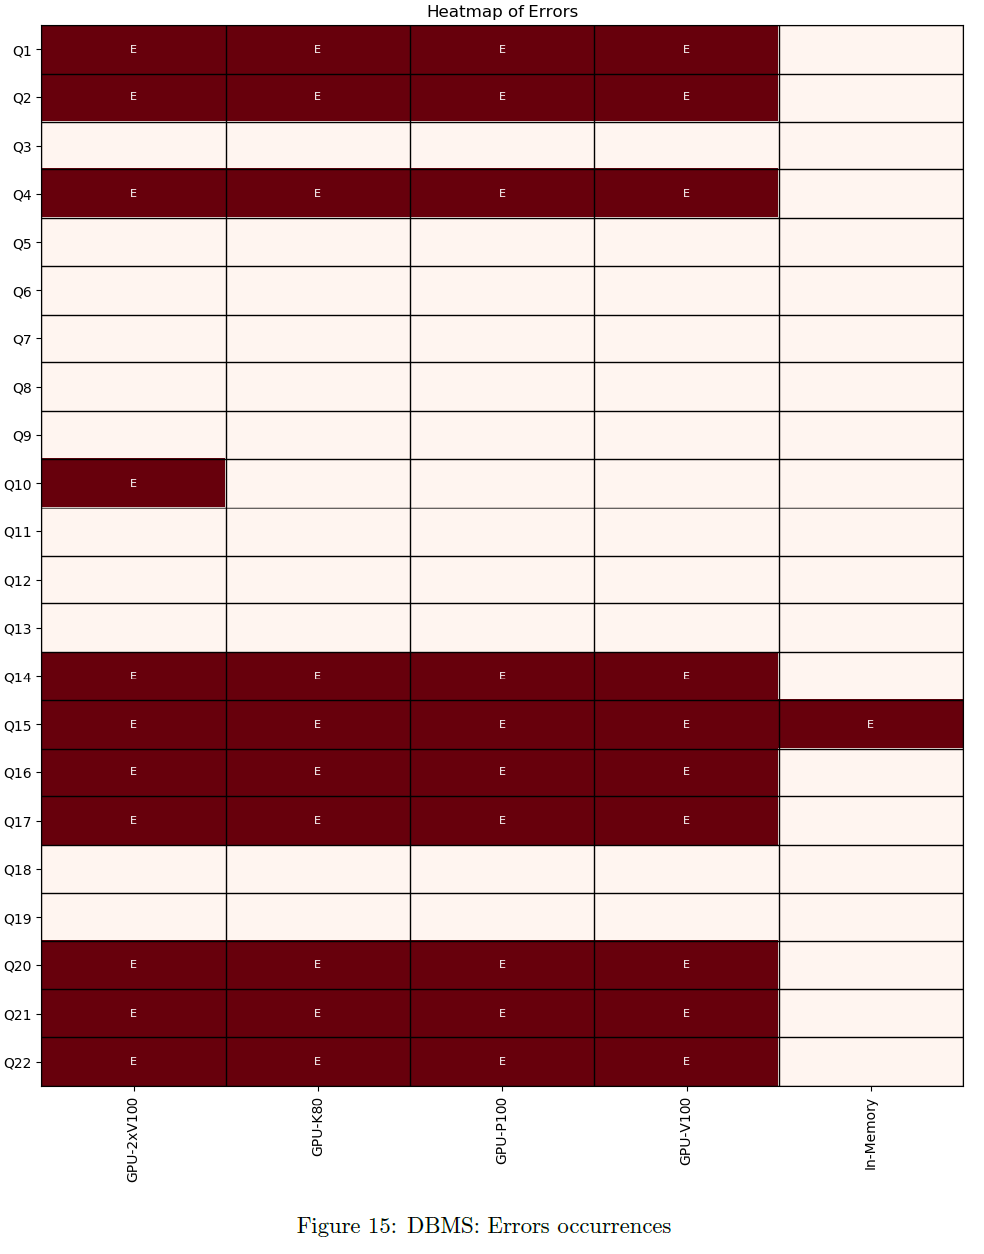
The chart shows per DBMS and per timer, if an error has occured. All active queries and DBMS are considered.
Warnings
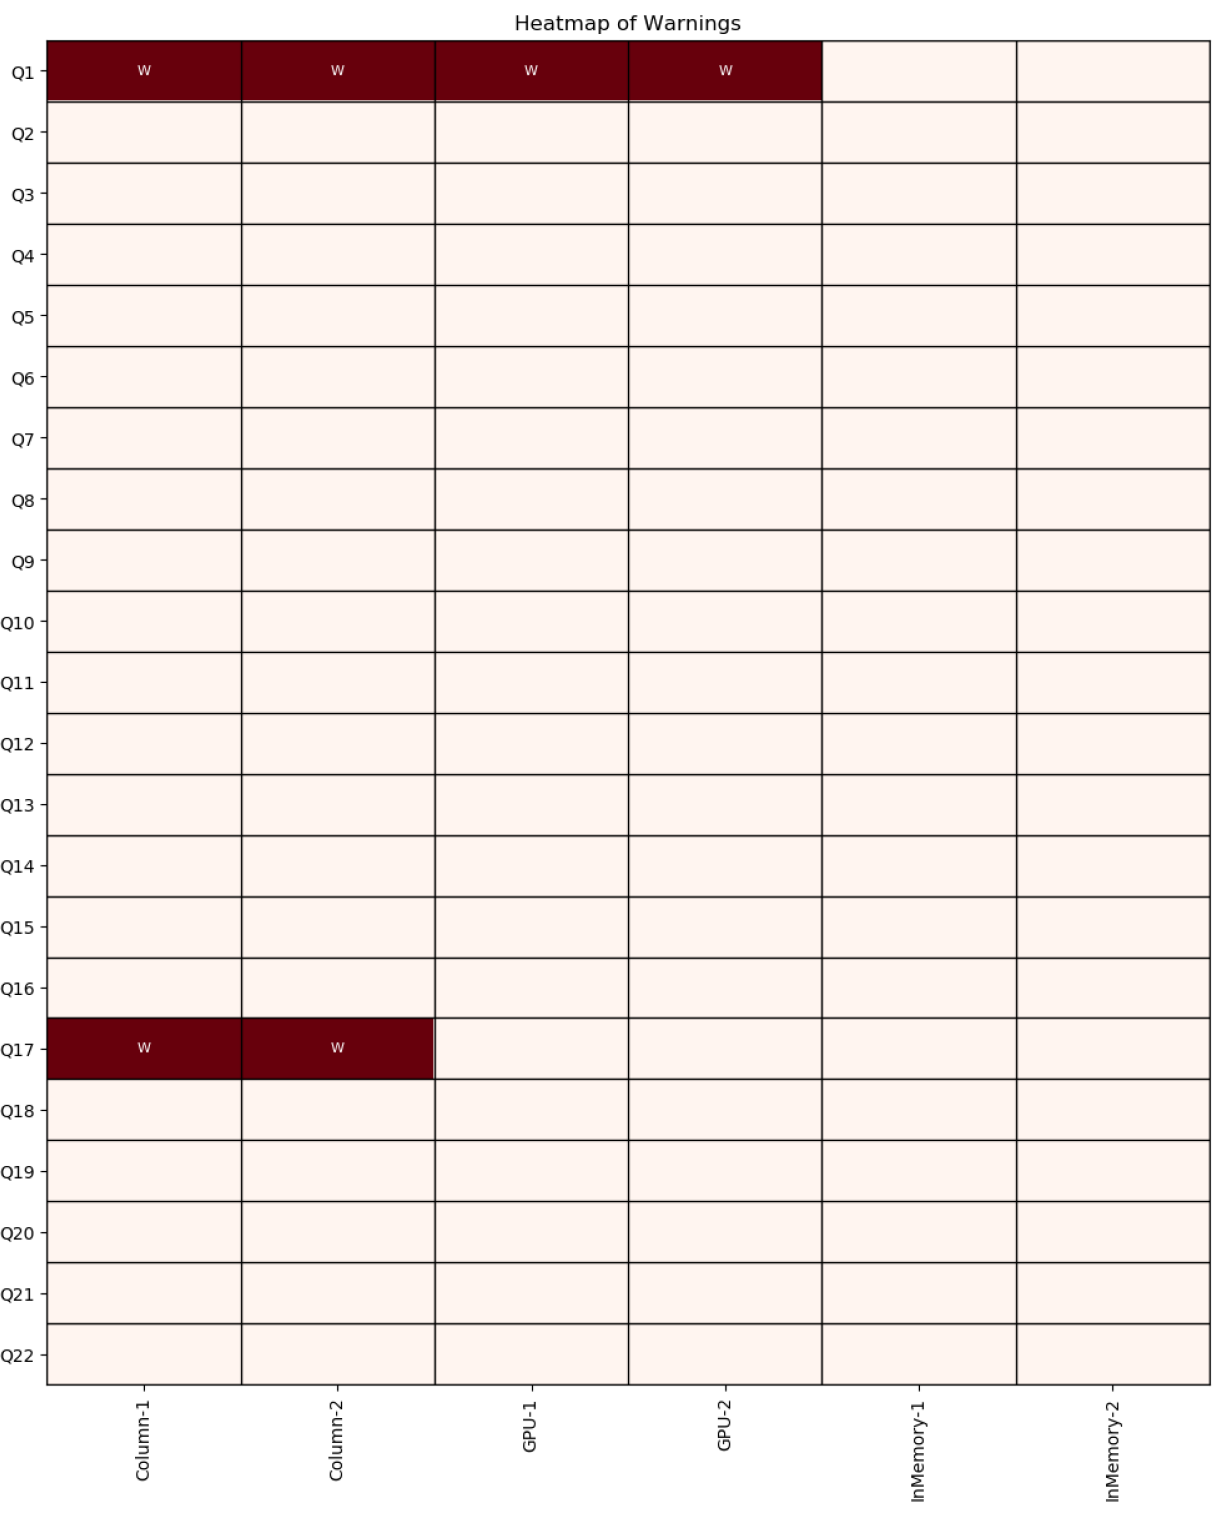
The chart shows per DBMS and per timer, if a warning has occured. All active queries and DBMS are considered.
Slice Queries
Latency and Throughput per Query
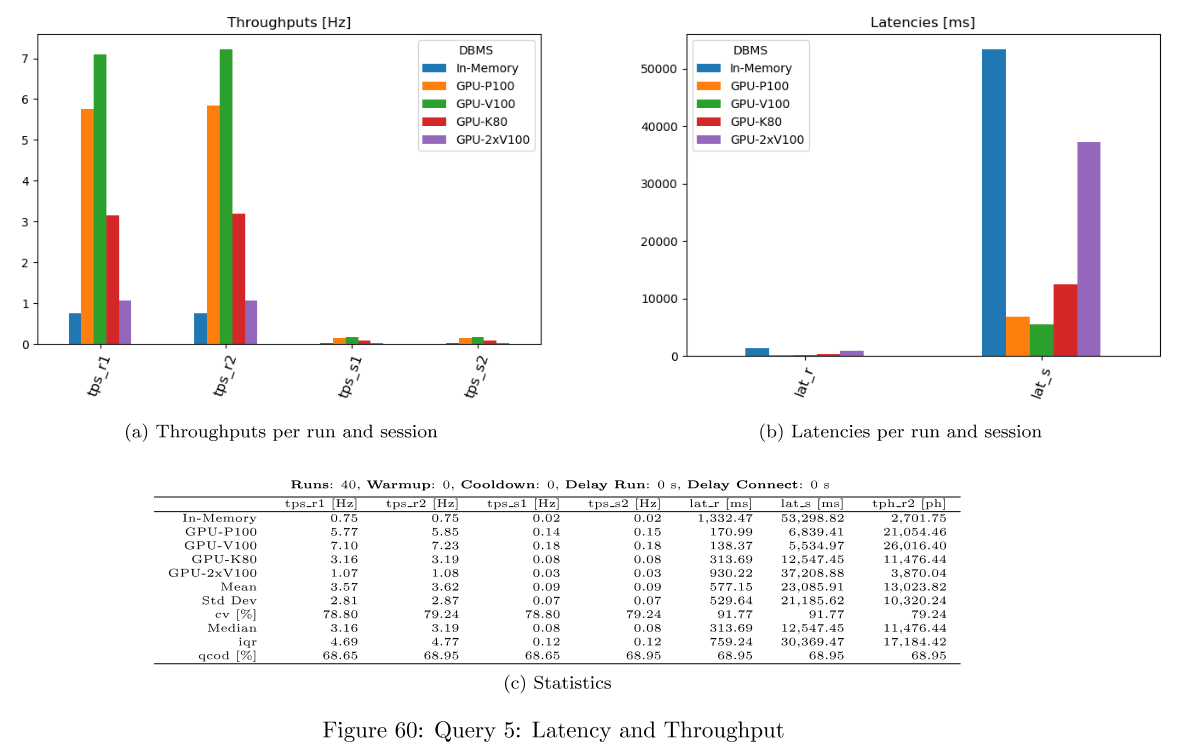
For each query, latency and throughput is computed per DBMS. This is available as dataframes, in the evaluation dict and as png files per query. Only successful queries and DBMS not producing any error are considered there.
Hardware Metrics per Query
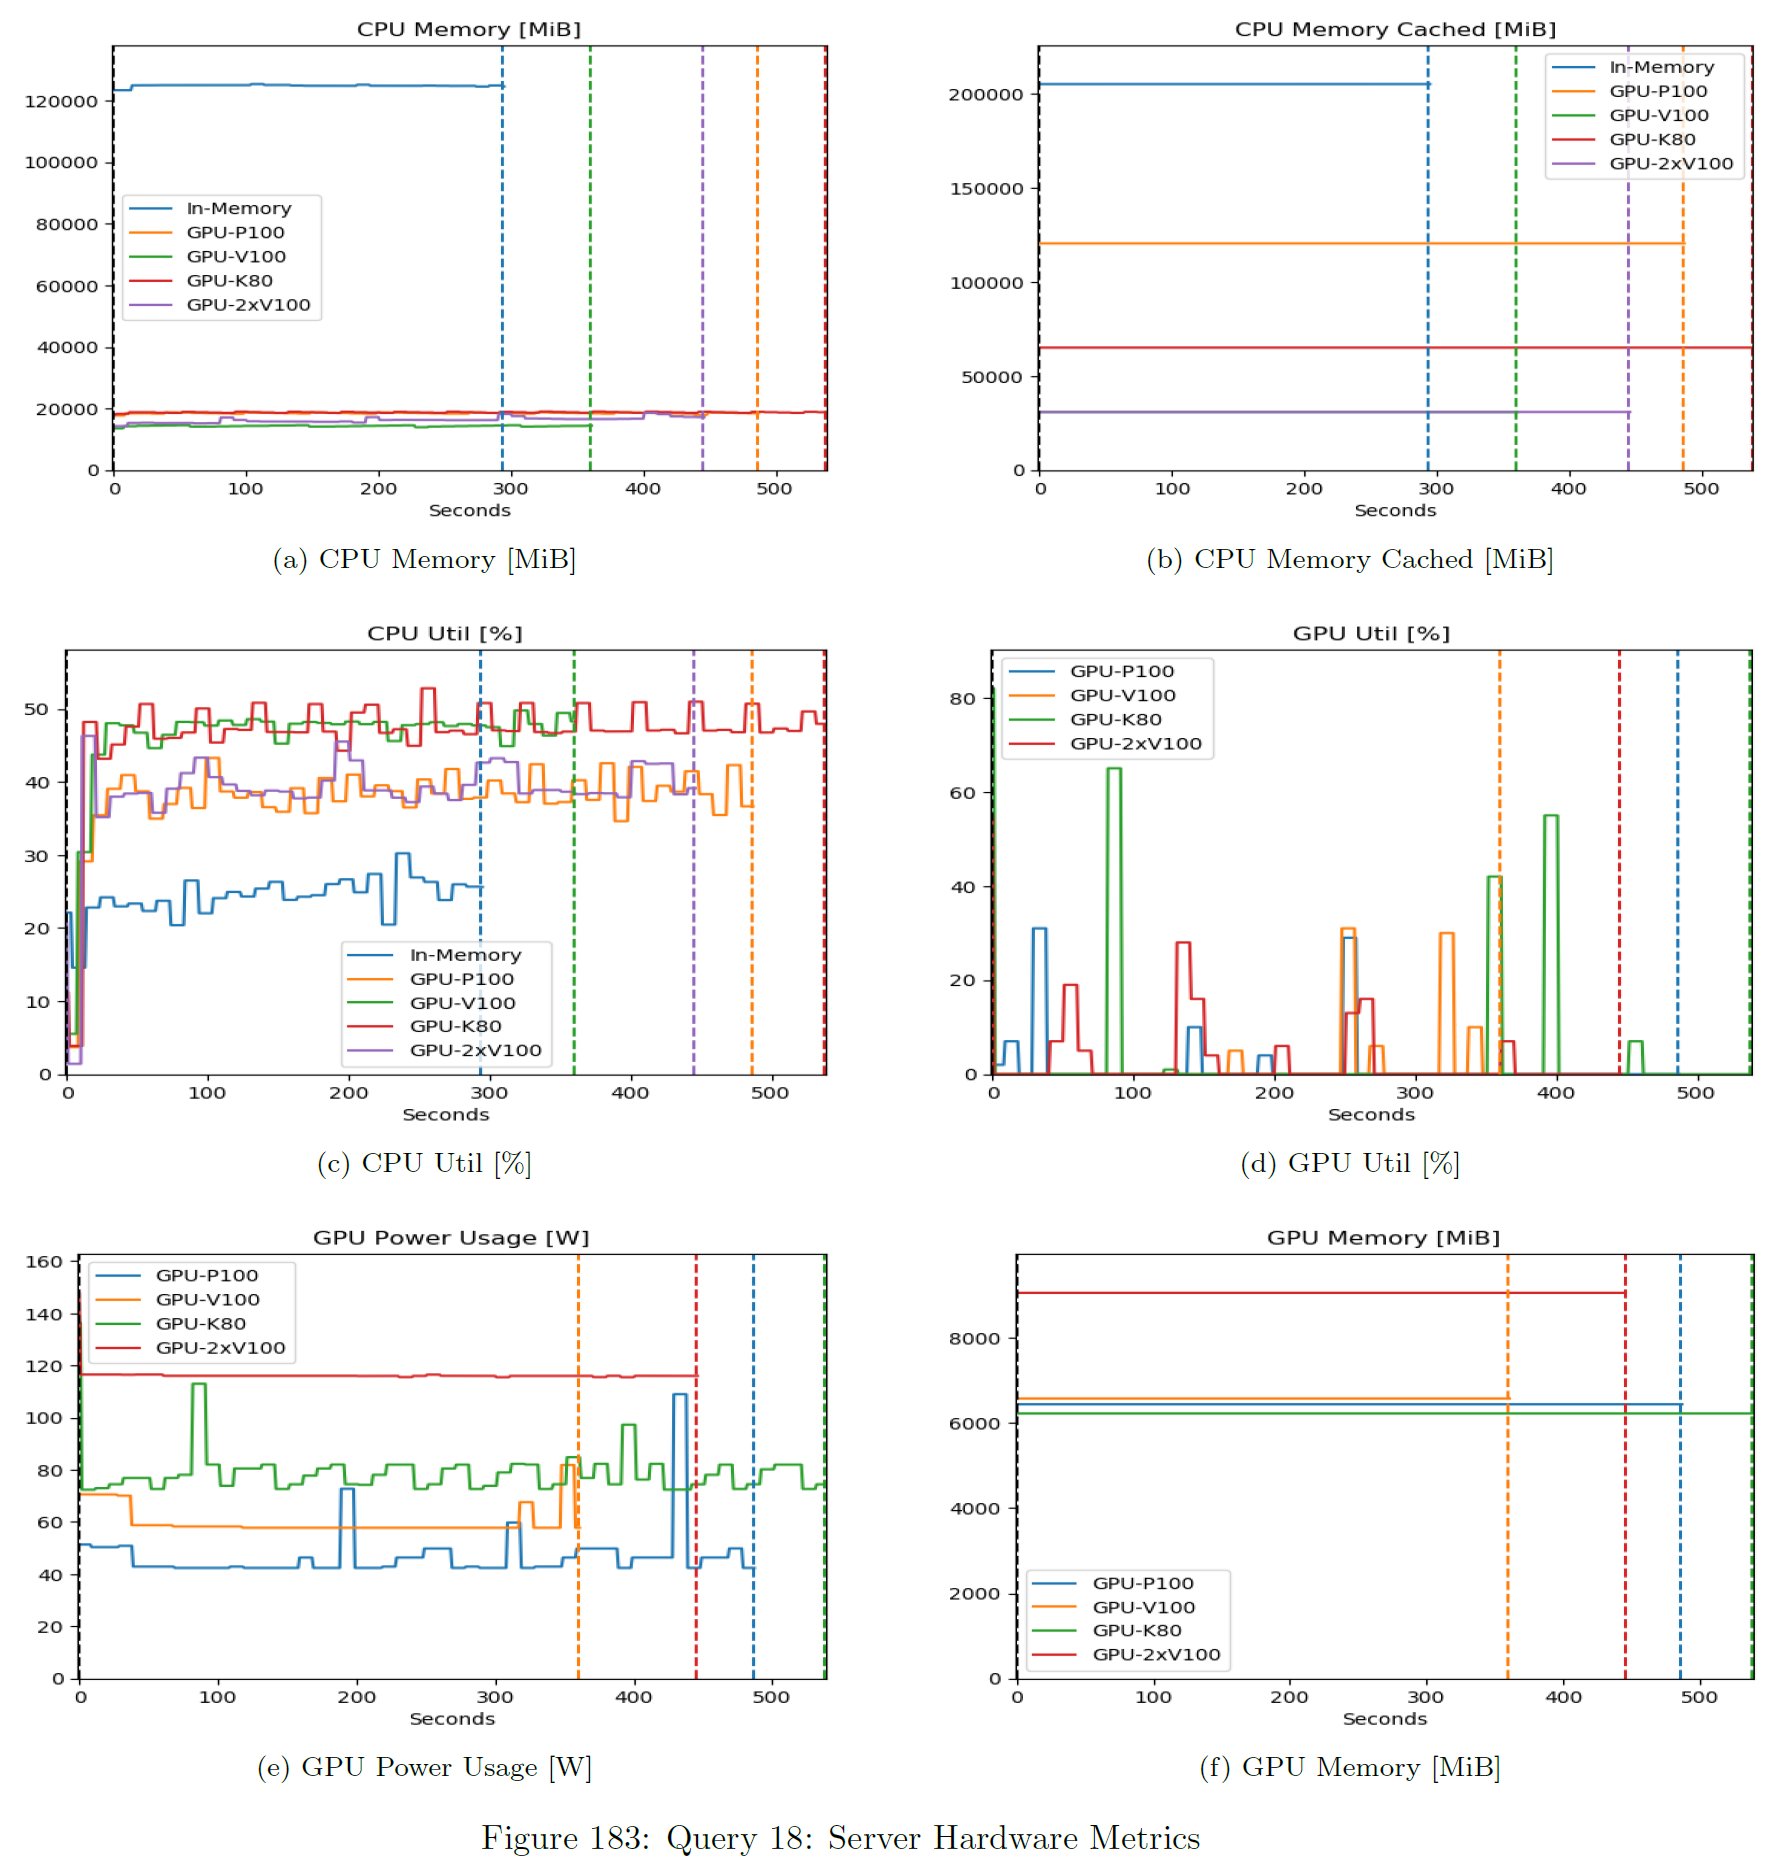
These metrics are collected from a Prometheus / Grafana stack. This expects time-synchronized servers.
Timers Per Query
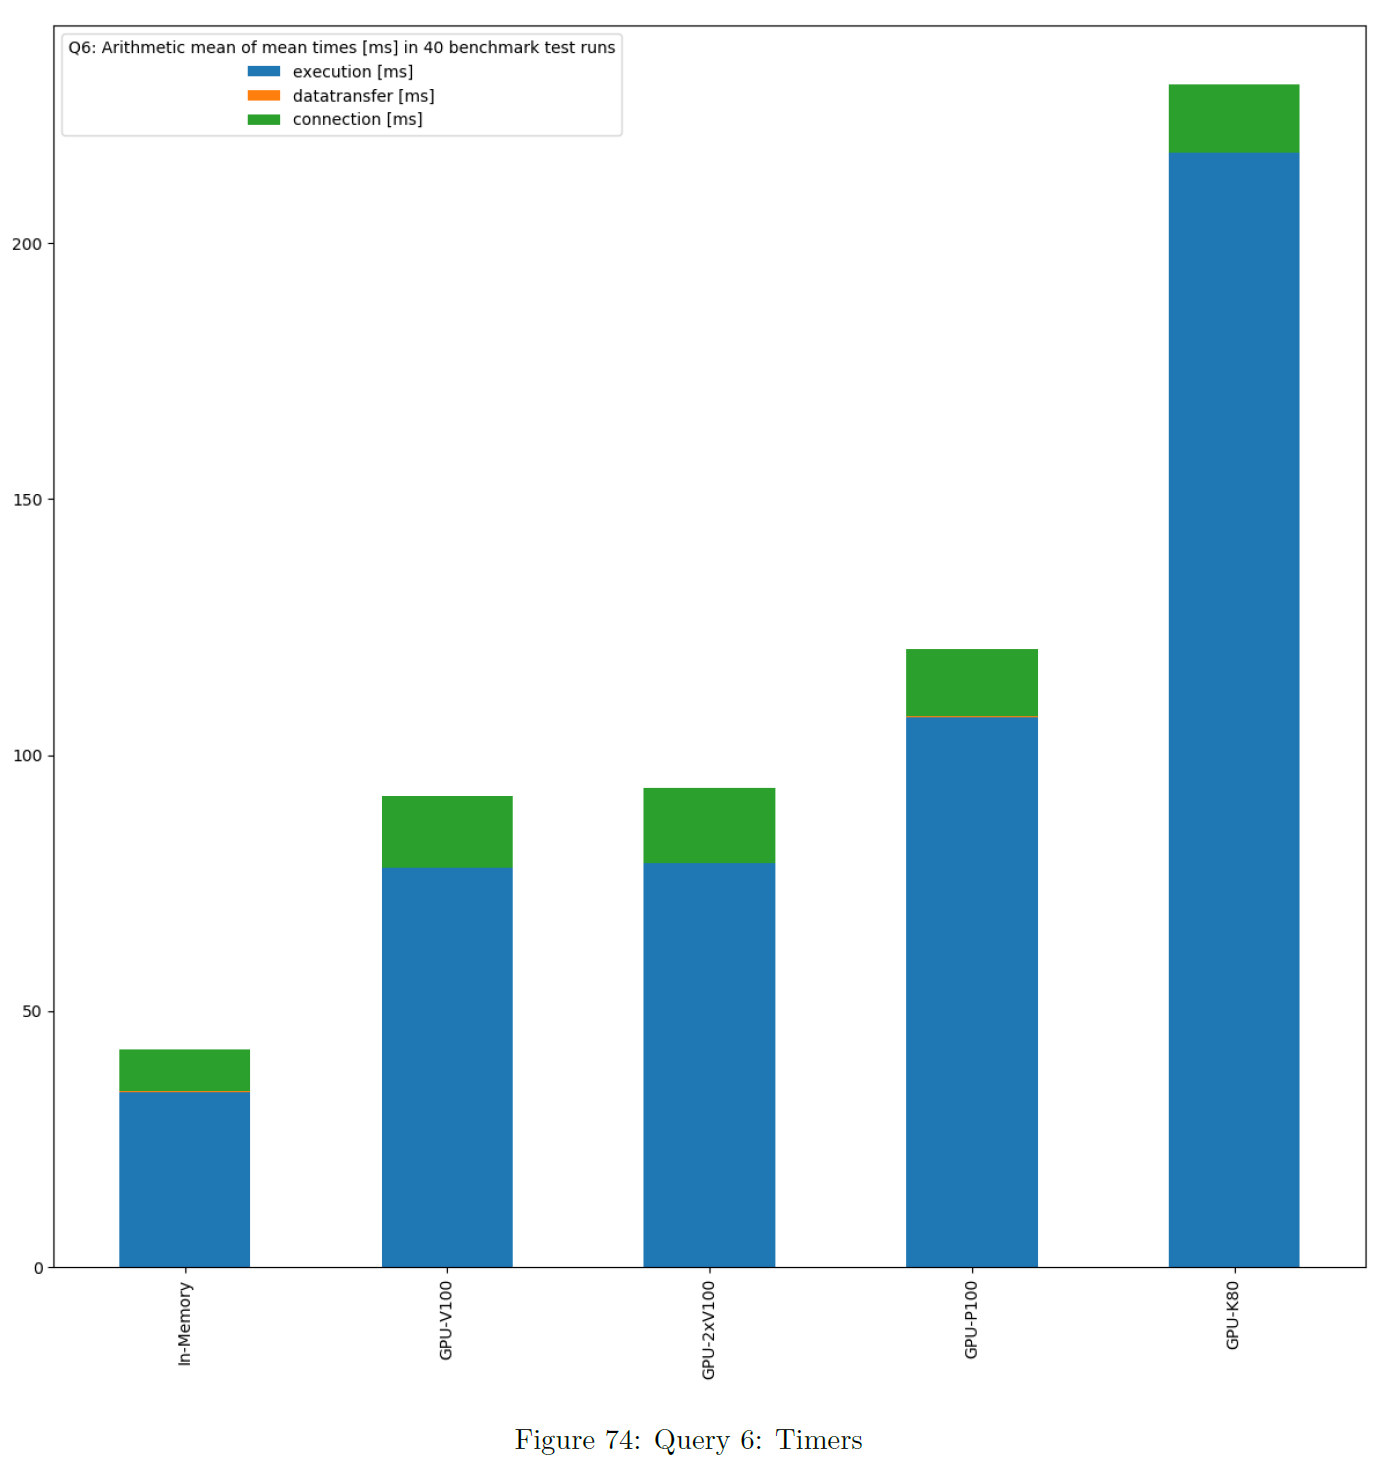
This is based on the sum of times of all single benchmark test runs. These charts show the average of times per DBMS based on mean value. Warmup and cooldown are not included. If data transfer or connection time is also benchmarked, the chart is stacked. The bars are ordered ascending.
Slice Queries and Timers
Statistics Table
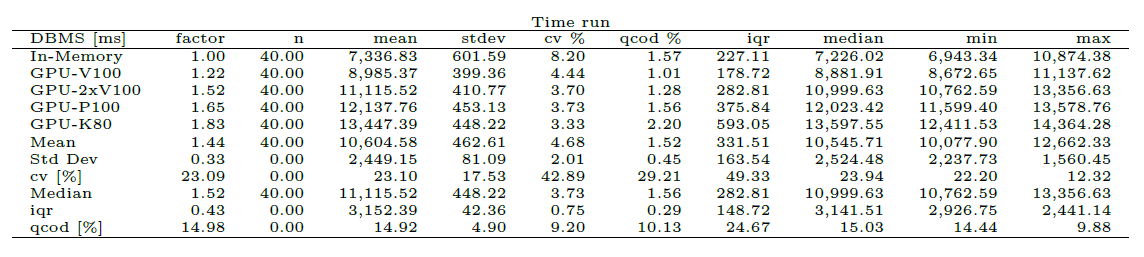
These tables show statistics about benchmarking time during the various runs per DBMS as a table. Warmup and cooldown are not included. This is for inspection of stability. A factor column is included. This is computed as the multiple of the minimum of the mean of benchmark times per DBMS. The DBMS are ordered ascending by factor.
Plot of Values
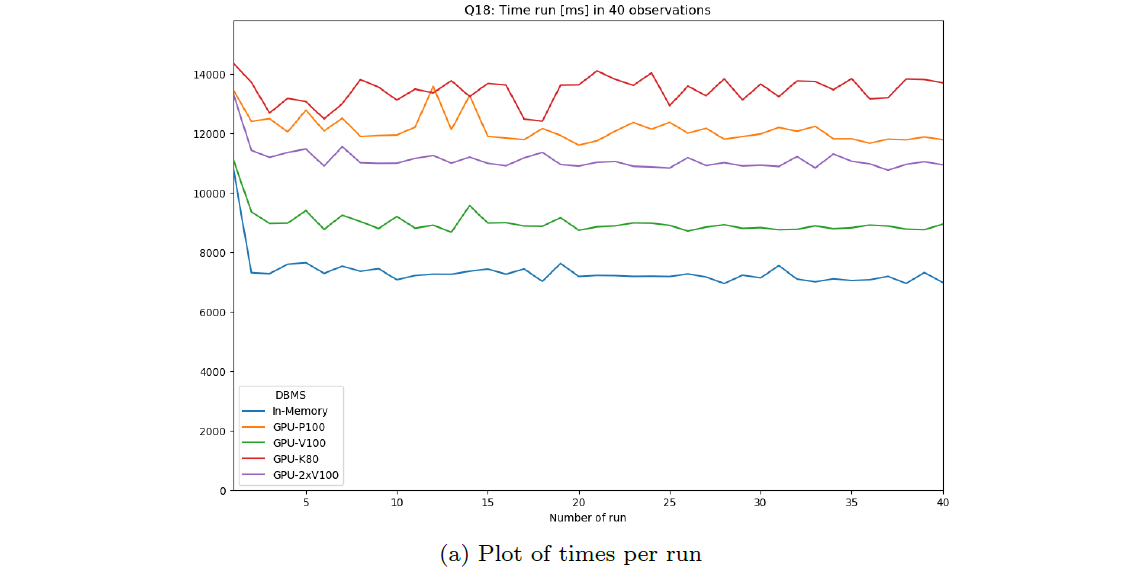
These plots show the variation of benchmarking time during the various runs per DBMS as a plot. Warmup and cooldown are included and marked as such. This is for inspection of time dependence.
Note this is only reliable for non-parallel runs.
Boxplot of Values
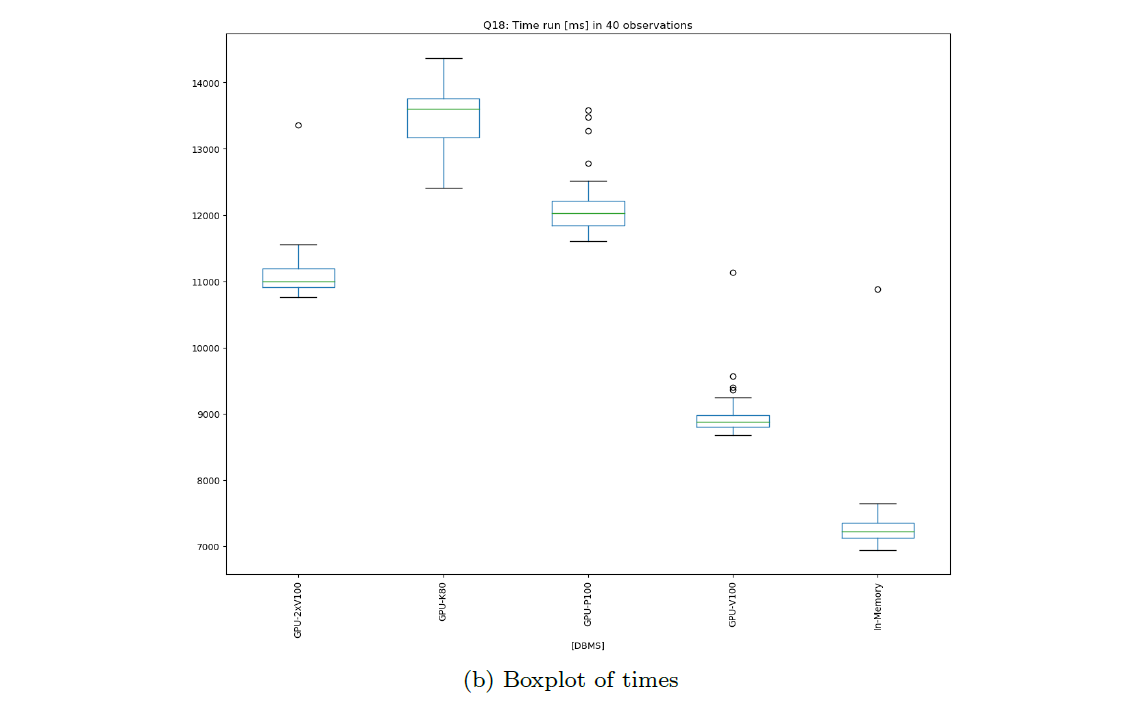
These plots show the variation of benchmarking time during the various runs per DBMS as a boxplot. Warmup, cooldown and zero (missing) values are not included. This is for inspection of variation and outliers.
Histogram of Values
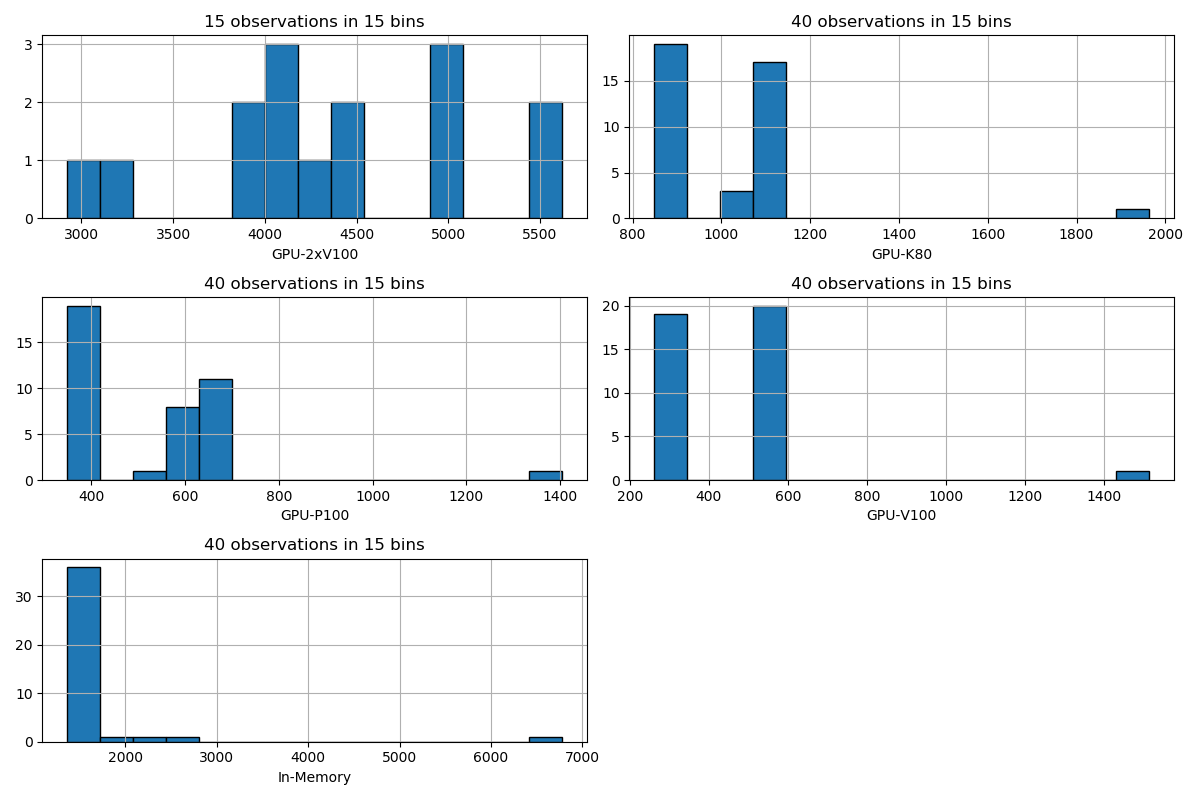
These plots show the variation of benchmarking time during the various runs per DBMS as a histogram. The number of bins equals the minimum number of result times. Warmup, cooldown and zero (missing) values are not included. This is for inspection of the distribution of times.
Further Data
Result Sets per Query
The result set (sorted values, hashed or pure size) of the first run of each DBMS can be saved per query. This is for comparison and inspection.
All Benchmark Times
The benchmark times of all runs of each DBMS can be saved per query. This is for comparison and inspection.
All Errors
The errors that may have occured are saved for each DBMS and per query. The error messages are fetched from Python exceptions thrown during a benchmark run. This is for inspection of problems.
All Warnings
The warnings that may have occured are saved for each DBMS and per query. The warning messages are generated if comparison of result sets detects any difference. This is for inspection of problems.
Initialization Scripts
If the result folder contains init scripts, they will be included in the dashboard.
Bexhoma Workflow
If the result folder contains the configuration of a bexhoma workflow, it will be included in the dashboard.
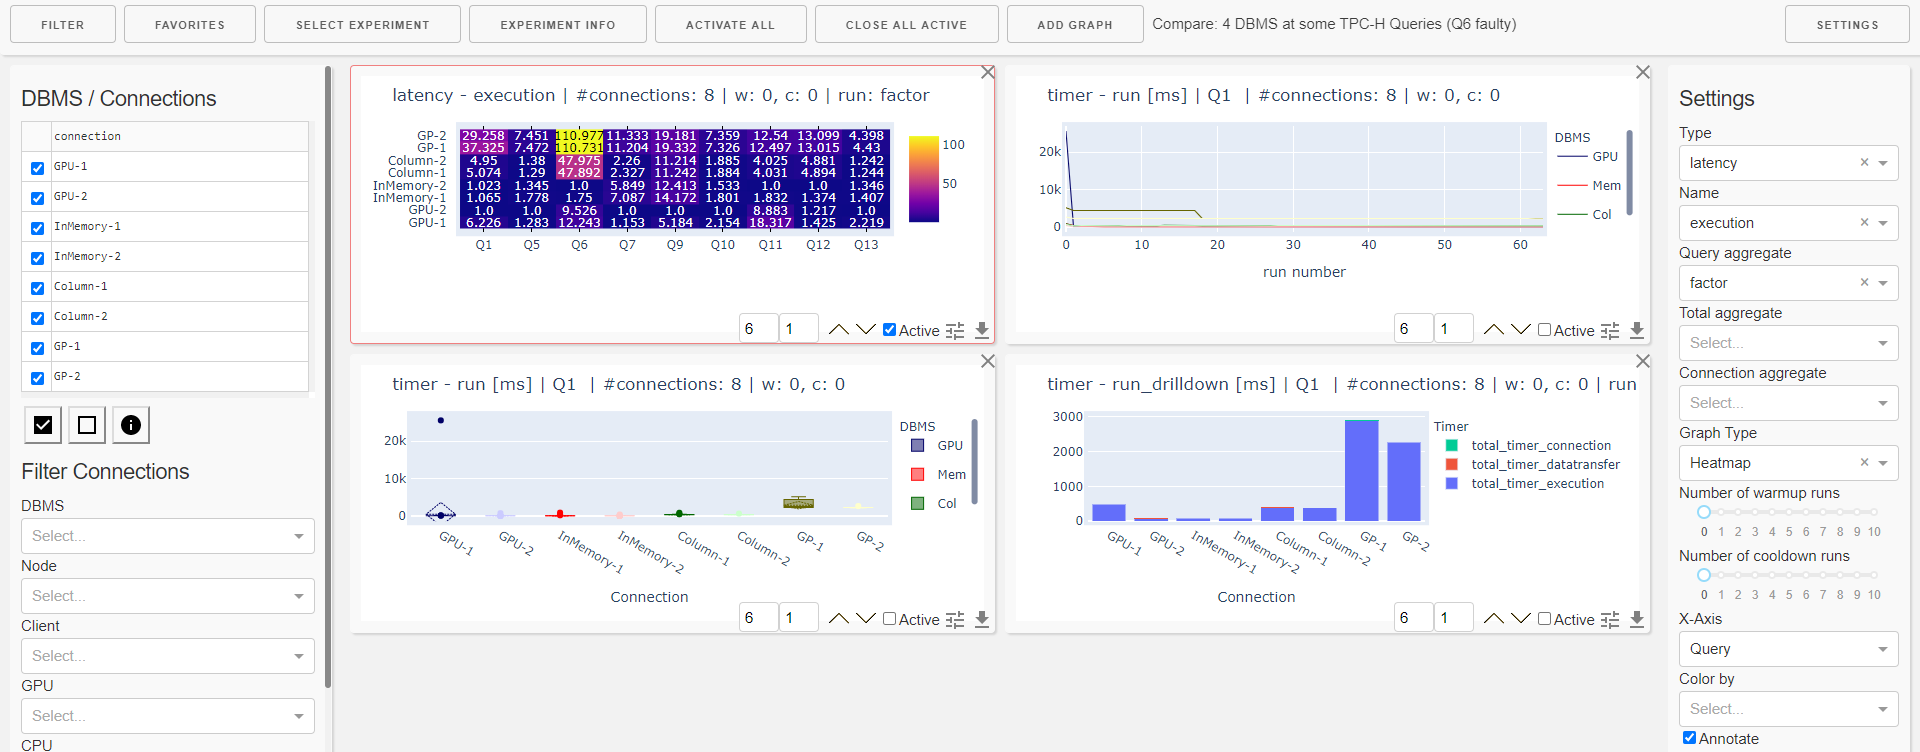
Dashboard
The dashboard helps in interactive evaluation of experiment results.
Start
The dashboard is started using a Python script:
python dashboard.py -h
usage: dashboard.py [-h] [-r RESULT_FOLDER] [-a] [-u USER] [-p PASSWORD] [-d]

Dashboard for interactive inspection of dbmsbenchmarker results.

optional arguments:
  -h, --help            show this help message and exit
  -r RESULT_FOLDER, --result-folder RESULT_FOLDER
                        Folder storing benchmark result files.
  -a, --anonymize       Anonymize all dbms.
  -u USER, --user USER  User name for auth protected access.
  -p PASSWORD, --password PASSWORD
                        Password for auth protected access.
  -d, --debug           Show debug information.
It has two options:
--result-folder: Path of a local folder containing result folders. This parameter is the same as forbenchmark.py--anonymize: If this flag is set, all DBMS are anonymized following the parameters in their configuration.
When you start the dashboard it is available at localhost:8050.
Select Experiment
You will be shown a list of experiments available at the path you have provided. Select one experiment. Optionally you can activate to have some default panels that will be included at start.
Concept
The dashboard analyzes the data in three dimensions using various aggregation functions:
Data
The cells of the runtime cube contain timer (connection, execution, data transfer, run and session) and derived metrics (latencies, throughput). The cells of the monitoring cube contain hardware metrics.
Graph Panels
The dashboard is organized into 12 columns and several rows depending on the screen size. For a single graph panel you can
change width (number of columns)
change height (number of rows)
change ordering on the dashboard
activate settings
download underlying data as csv.
Graph Types
Available types of display are
Line Plot
Boxplot
Histogramm
Bar Chart
Heatmap
Table of Measures
Table of Statistics
These can be applied to sliced / diced / aggregated data of the cubes.
There are also some preset graphs
Heatmap of Errors
Heatmap of Warnings
Heatmap Result Set Size
Heatmap Total Time
Heatmap Latency Run
Heatmap Throughput Run
Heatmap Timer Run Factor
Bar Chart Run drill-down
Bar Chart Ingestion Time
Favorites
The favorites menu allows you to
load a dashboard
append a list of panels to the current dashboard
save the current list of panels as a favorite
download a favorite
upload a favorite
Settings
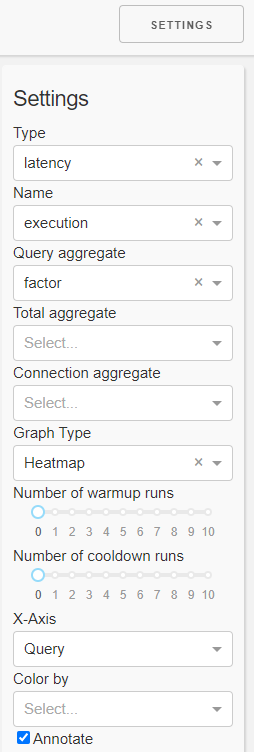
In the settings panel you can select the
Kind of measure you want to inspect (kind, name)
Type of plot (graph type, x-axis, annotate)
Aggregation functions. The order of aggregation is
Query (run dimension)
Total (query dimension)
Connection (configuration dimension)
Aggregation in the connection dimension can be drilled-down (color by)
a number of warmup runs and a number of cooldown runs
This means the first n runs resp. the last n runs are ignored in evaluation.
Note this is only reliable for non-parallel connections.
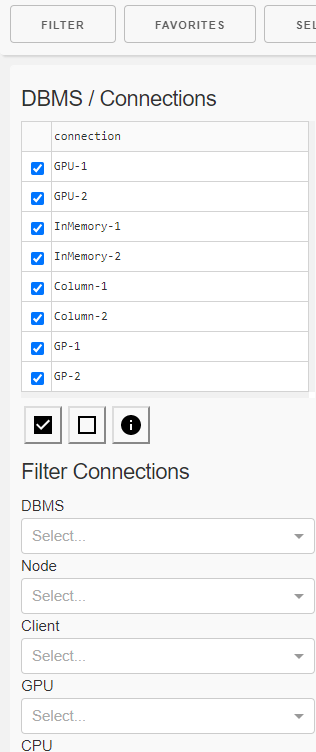
Filter
In the filter panel you can
filter
one or more connections (configurations) using
a checkbox list of single connections
property filters
DBMS
Cluster node
Number of clients
CPU
GPU
single queries
receive details about
the connections (configurations)
DBMS
Resources
and the queries like
Number of runs
Result sets
Inspector
Start the inspector:
result_path = 'tmp/results'
code = '1234512345'
benchmarks = benchmarker.inspector(result_path, code)
Get General Informations and Evaluations
# list of successful queries
qs = benchmarks.listQueries()
# list of connections
cs = benchmarks.listConnections()
# print all errors
benchmarks.printErrors()
# get survey evaluation
dftt, title = benchmarks.getTotalTime()
dfts, title = benchmarks.getSumPerTimer()
dftp, title = benchmarks.getProdPerTimer()
dftr, title = benchmarks.generateSortedTotalRanking()
# get evaluation dict
e = evaluator.evaluator(benchmarks)
# show it
e.pretty()
# show part about query 1
e.pretty(e.evaluation['query'][1])
# get dataframe of benchmarks for query 1 and timerRun
dfb1 = benchmarks.benchmarksToDataFrame(1,benchmarks.timerRun)
# get dataframe of statistics for query 1 and timerRun
dfs1 = benchmarks.statsToDataFrame(1,benchmarks.timerRun)
Get Informations and Evaluations for a Specific DBMS and Query:
# pick first connection (dbms)
connectionname = cs[0]

# pick a query
numQuery = 10

# get infos about query
q = benchmarks.getQueryObject(numQuery)
print(q.title)

# get benchmarks and statistics for specific query
dfb1 = benchmarks.getBenchmarks(numQuery)
dfb1b = benchmarks.getBenchmarksCSV(numQuery)
dfs1 = benchmarks.getStatistics(numQuery)
dfr1 = benchmarks.getResultSetDF(numQuery, connectionname)

# get error of connection at specific query
benchmarks.getError(numQuery, connectionname)

# get all errors of connection at specific query
benchmarks.getError(numQuery)

# get data storage (for comparison) for specific query and benchmark run
numRun = 0
df1=benchmarks.readDataStorage(numQuery,numRun)
df2=benchmarks.readResultSet(numQuery, cs[1],numRun)
inspector.getDifference12(df1, df2)

# get query String for specific query
queryString = benchmarks.getQueryString(numQuery)
print(queryString)

# get query String for specific query and and dbms
queryString = benchmarks.getQueryString(numQuery, connectionname=connectionname)
print(queryString)

# get query String for specific query and and dbms and benchmark run
queryString = benchmarks.getQueryString(numQuery, connectionname=connectionname, numRun=1)
print(queryString)
Run some Isolated Queries
# run single benchmark run for specific query and connection
# this is for an arbitrary query string - not contained in the query config
# result is not stored and does not go into any reporting
queryString = "SELECT COUNT(*) c FROM test"
output = benchmarks.runIsolatedQuery(connectionname, queryString)
print(output.durationConnect)
print(output.durationExecute)
print(output.durationTransfer)
df = tools.dataframehelper.resultsetToDataFrame(output.data)
print(df)


# run single benchmark run multiple times for specific query and connection
# this is for an arbitrary query string - not contained in the query config
# result is not stored and does not go into any reporting
queryString = "SELECT COUNT(*) c FROM test"
output = benchmarks.runIsolatedQueryMultiple(connectionname, queryString, times=10)
print(output.durationConnect)
print(output.durationExecute)
print(output.durationTransfer)
# compute statistics for execution
df = tools.dataframehelper.timesToStatsDataFrame(output.durationExecute)
print(df)


# the following is handy when comparing result sets of different dbms

# run an arbitrary query
# this saves the result set data frame to
#   "query_resultset_"+connectionname+"_"+queryName+".pickle"
queryName = "test"
queryString = "SELECT COUNT(*) c FROM test"
benchmarks.runAndStoreIsolatedQuery(connectionname, queryString, queryName)

# we can also easily load this data frame
df = benchmarks.getIsolatedResultset(connectionname, queryName)
Debug Tool
There is a debug tool, that helps to analyze result folders: python evaluate.py -h
usage: evaluate.py [-h] [-r RESULT_FOLDER] [-e EXPERIMENT] [-q QUERY] [-c CONNECTION] [-n NUM_RUN] [-d] [-rt] {resultsets,errors,warnings,query}

A debug tool for DBMSBenchmarker. It helps to analyze a result folder. It depends on the evaluation cube, so that cube must have been created before.

positional arguments:
  {resultsets,errors,warnings,query}
                        show debug infos about which part of the outcome

optional arguments:
  -h, --help            show this help message and exit
  -r RESULT_FOLDER, --result-folder RESULT_FOLDER
                        folder for storing benchmark result files, default is given by timestamp
  -e EXPERIMENT, --experiment EXPERIMENT
                        code of experiment
  -q QUERY, --query QUERY
                        number of query to inspect
  -c CONNECTION, --connection CONNECTION
                        name of DBMS to inspect
  -n NUM_RUN, --num-run NUM_RUN
                        number of run to inspect
  -d, --diff            show differences in result sets
  -rt, --remove-titles  remove titles when comparing result sets
It depends on the evaluation cube. In case, it can be generated by dbmsbenchmarker -e yes -r 1647993954 read for example for experiment 1647993954.
Show Queries
We can take a look at the actual queries that have been sent: python evaluate.py -e 1647993954 -q 1 -n 0 query
This shows the query string for query number 2, first run.
Show Result Sets
We can take a look at the actual queries that have been sent: python evaluate.py -e 1647993954 -q 2 resultsets
This shows the query string for query number 2.
Show Errors
We can take a look at the actual queries that have been sent: python evaluate.py -e 1647993954 errors
Show Warnings
We can take a look at the actual queries that have been sent: python evaluate.py -e 1647993954 warnings

DBMS-Benchmarker
DBMS-Benchmarker is a Python-based application-level blackbox benchmark tool for Database Management Systems (DBMS). It aims at reproducible measuring and easy evaluation of the performance the user receives even in complex benchmark situations. It connects to a given list of DBMS (via JDBC) and runs a given list of (SQL) benchmark queries. Queries can be parametrized and randomized. Results and evaluations are available via a Python interface and can be inspected with standard Python tools like pandas DataFrames. An interactive visual dashboard assists in multi-dimensional analysis of the results.
See the homepage and the documentation.
Key Features
DBMS-Benchmarker
is Python3-based
helps to benchmark DBMS
connects to all DBMS having a JDBC interface - including GPU-enhanced DBMS
requires only JDBC - no vendor specific supplements are used
benchmarks arbitrary SQL queries - in all dialects
allows planning of complex test scenarios - to simulate realistic or revealing use cases
allows easy repetition of benchmarks in varying settings - different hardware, DBMS, DBMS configurations, DB settings etc
investigates a number of timing aspects - connection, execution, data transfer, in total, per session etc
investigates a number of other aspects - received result sets, precision, number of clients
collects hardware metrics from a Prometheus server - hardware utilization, energy consumption etc
helps to evaluate results - by providing
metrics that can be analyzed by aggregation in multi-dimensions, like maximum throughput per DBMS, average CPU utilization per query or geometric mean of run latency per workload
predefined evaluations like statistics
in standard Python data structures
in an interactive dashboard
For more informations, see a basic example or take a look in the documentation for a full list of options.
The code uses several Python modules, in particular jaydebeapi for handling DBMS. This module has been tested with Brytlyt, Citus, Clickhouse, DB2, Exasol, Kinetica, MariaDB, MariaDB Columnstore, MemSQL, Mariadb, MonetDB, MySQL, OmniSci, Oracle DB, PostgreSQL, SingleStore, SQL Server and SAP HANA.
Installation
Run pip install dbmsbenchmarker
Basic Usage
The following very simple use case runs the query SELECT COUNT(*) FROM test 10 times against one local MySQL installation.
As a result we obtain an interactive dashboard to inspect timing aspects.
Configuration
We need to provide
a DBMS configuration file, e.g. in
./config/connections.config[ { 'name': "MySQL", 'active': True, 'JDBC': { 'driver': "com.mysql.cj.jdbc.Driver", 'url': "jdbc:mysql://localhost:3306/database", 'auth': ["username", "password"], 'jar': "mysql-connector-java-8.0.13.jar" } } ]
the required JDBC driver, e.g.
mysql-connector-java-8.0.13.jara Queries configuration file, e.g. in
./config/queries.config{ 'name': 'Some simple queries', 'connectionmanagement': { 'timeout': 5 # in seconds }, 'queries': [ { 'title': "Count all rows in test", 'query': "SELECT COUNT(*) FROM test", 'numRun': 10 } ] }
Perform Benchmark
Run the CLI command: dbmsbenchmarker run -e yes -b -f ./config
-e yes: This will precompile some evaluations and generate the timer cube.-b: This will suppress some output-f: This points to a folder having the configuration files.
This is equivalent to python benchmark.py run -e yes -b -f ./config
After benchmarking has been finished we will see a message like
Experiment <code> has been finished
The script has created a result folder in the current directory containing the results. <code> is the name of the folder.
Evaluate Results in Dashboard
Run the command: dbmsdashboard
This will start the evaluation dashboard at localhost:8050.
Visit the address in a browser and select the experiment <code>.
Alternatively you may use a Jupyter notebook, see a rendered example.
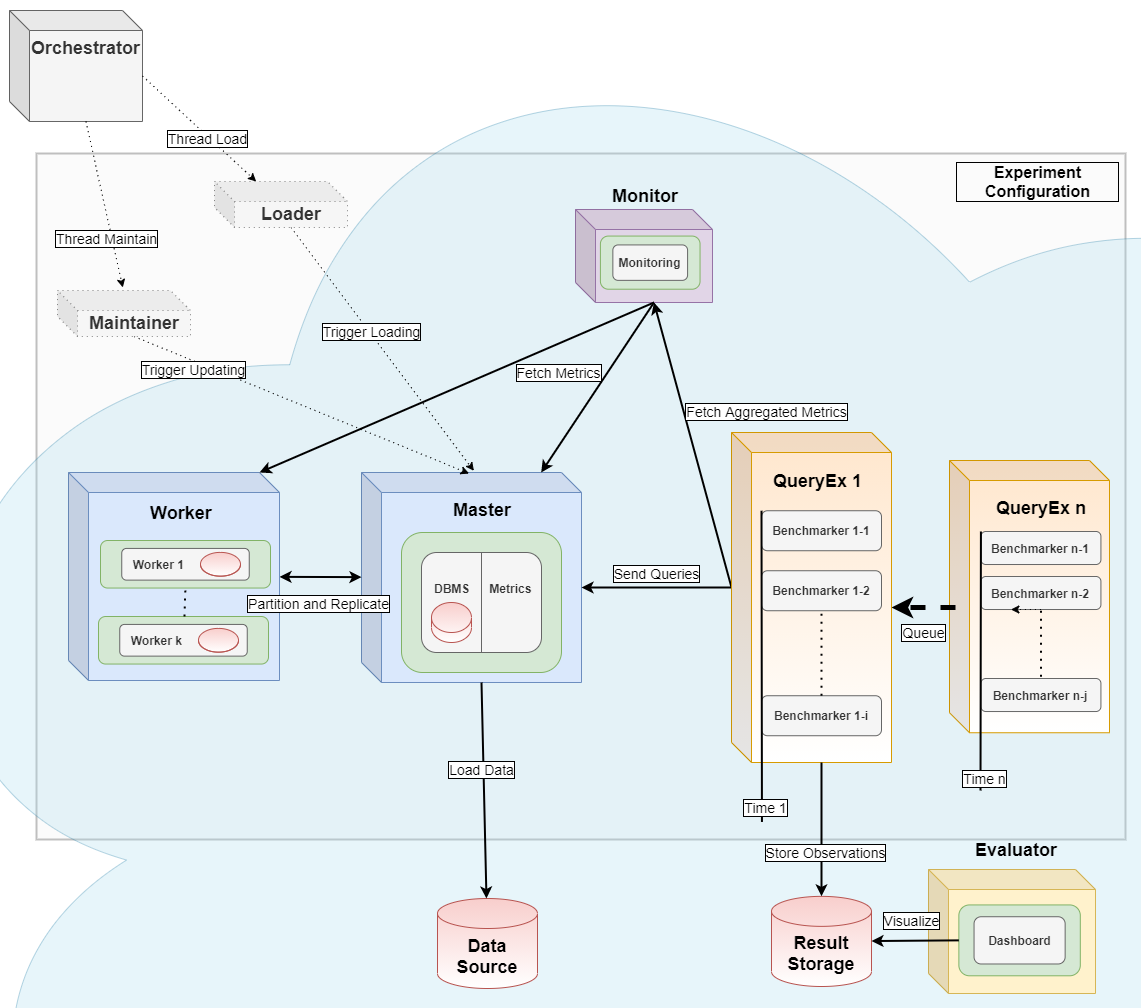
Benchmarking in a Kubernetes Cloud
This module can serve as the query executor [2] and evaluator [1] for distributed parallel benchmarking experiments in a Kubernetes Cloud, see the orchestrator for more details.
Limitations
Limitations are:
strict black box perspective - may not use all tricks available for a DBMS
strict JDBC perspective - depends on a JVM and provided drivers
strict user perspective - client system, network connection and other host workloads may affect performance
not officially applicable for well known benchmark standards - partially, but not fully complying with TPC-H and TPC-DS
hardware metrics are collected from a monitoring system - not as precise as profiling
no GUI for configuration
strictly Python - a very good and widely used language, but maybe not your choice
Other comparable products you might like
Apache JMeter - Java-based performance measure tool, including a configuration GUI and reporting to HTML
HammerDB - industry accepted benchmark tool, but limited to some DBMS
Sysbench - a scriptable multi-threaded benchmark tool based on LuaJIT
OLTPBench -Java-based performance measure tool, using JDBC and including a lot of predefined benchmarks
References
Erdelt P.K. (2021) A Framework for Supporting Repetition and Evaluation in the Process of Cloud-Based DBMS Performance Benchmarking. In: Nambiar R., Poess M. (eds) Performance Evaluation and Benchmarking. TPCTC 2020. Lecture Notes in Computer Science, vol 12752. Springer, Cham. https://doi.org/10.1007/978-3-030-84924-5_6
[2] Orchestrating DBMS Benchmarking in the Cloud with Kubernetes
Erdelt P.K. (2022) Orchestrating DBMS Benchmarking in the Cloud with Kubernetes. In: Nambiar R., Poess M. (eds) Performance Evaluation and Benchmarking. TPCTC 2021. Lecture Notes in Computer Science, vol 13169. Springer, Cham. https://doi.org/10.1007/978-3-030-94437-7_6
(old, slightly outdated docs)