Evaluation
After an experiment has finished, the results can be evaluated. We show here some example evaluations to illustrate what is possible.
Example Evaluations
Some example evaluations
Global Metrics
average position
latency and throughput
ingestion
hardware metrics
host metrics
Drill-Down Timers
relative position
average times
Slices of Timers
heatmap of factors
Drill-Down Queries
total times
normalized total times
latencies
throughputs
sizes of result sets
errors
warnings
Slices of Queries
latency and throughput
hardware metrics
timers
Slices of Queries and Timers
statistics - measures of tendency and dispersion, sensitive and insensitive to outliers
plots of times
box plots of times
summarizing and exhaustive latex reports containing further data like
precision and identity checks of result sets
error messages
warnings
benchmark times
experiment workflow
initialization scripts
an interactive inspection tool
a Latex report containing most of these
Informations about DBMS
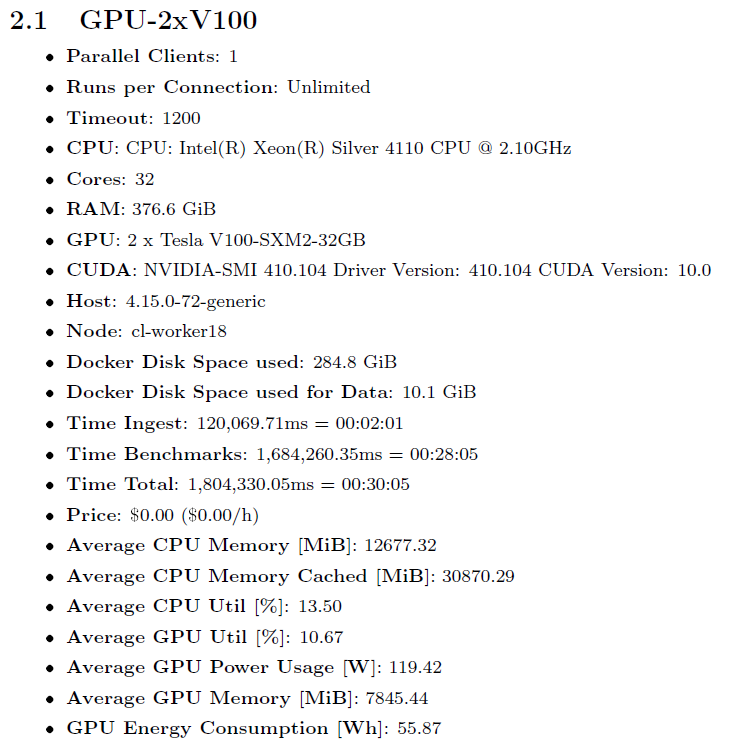
The user has to provide in a config file
a unique name (connectionname)
JDBC connection information
If a monitoring interface is provided, hardware metrics are collected and aggregated. We may further provide describing information for reporting.
Global Metrics
Latency and Throughput
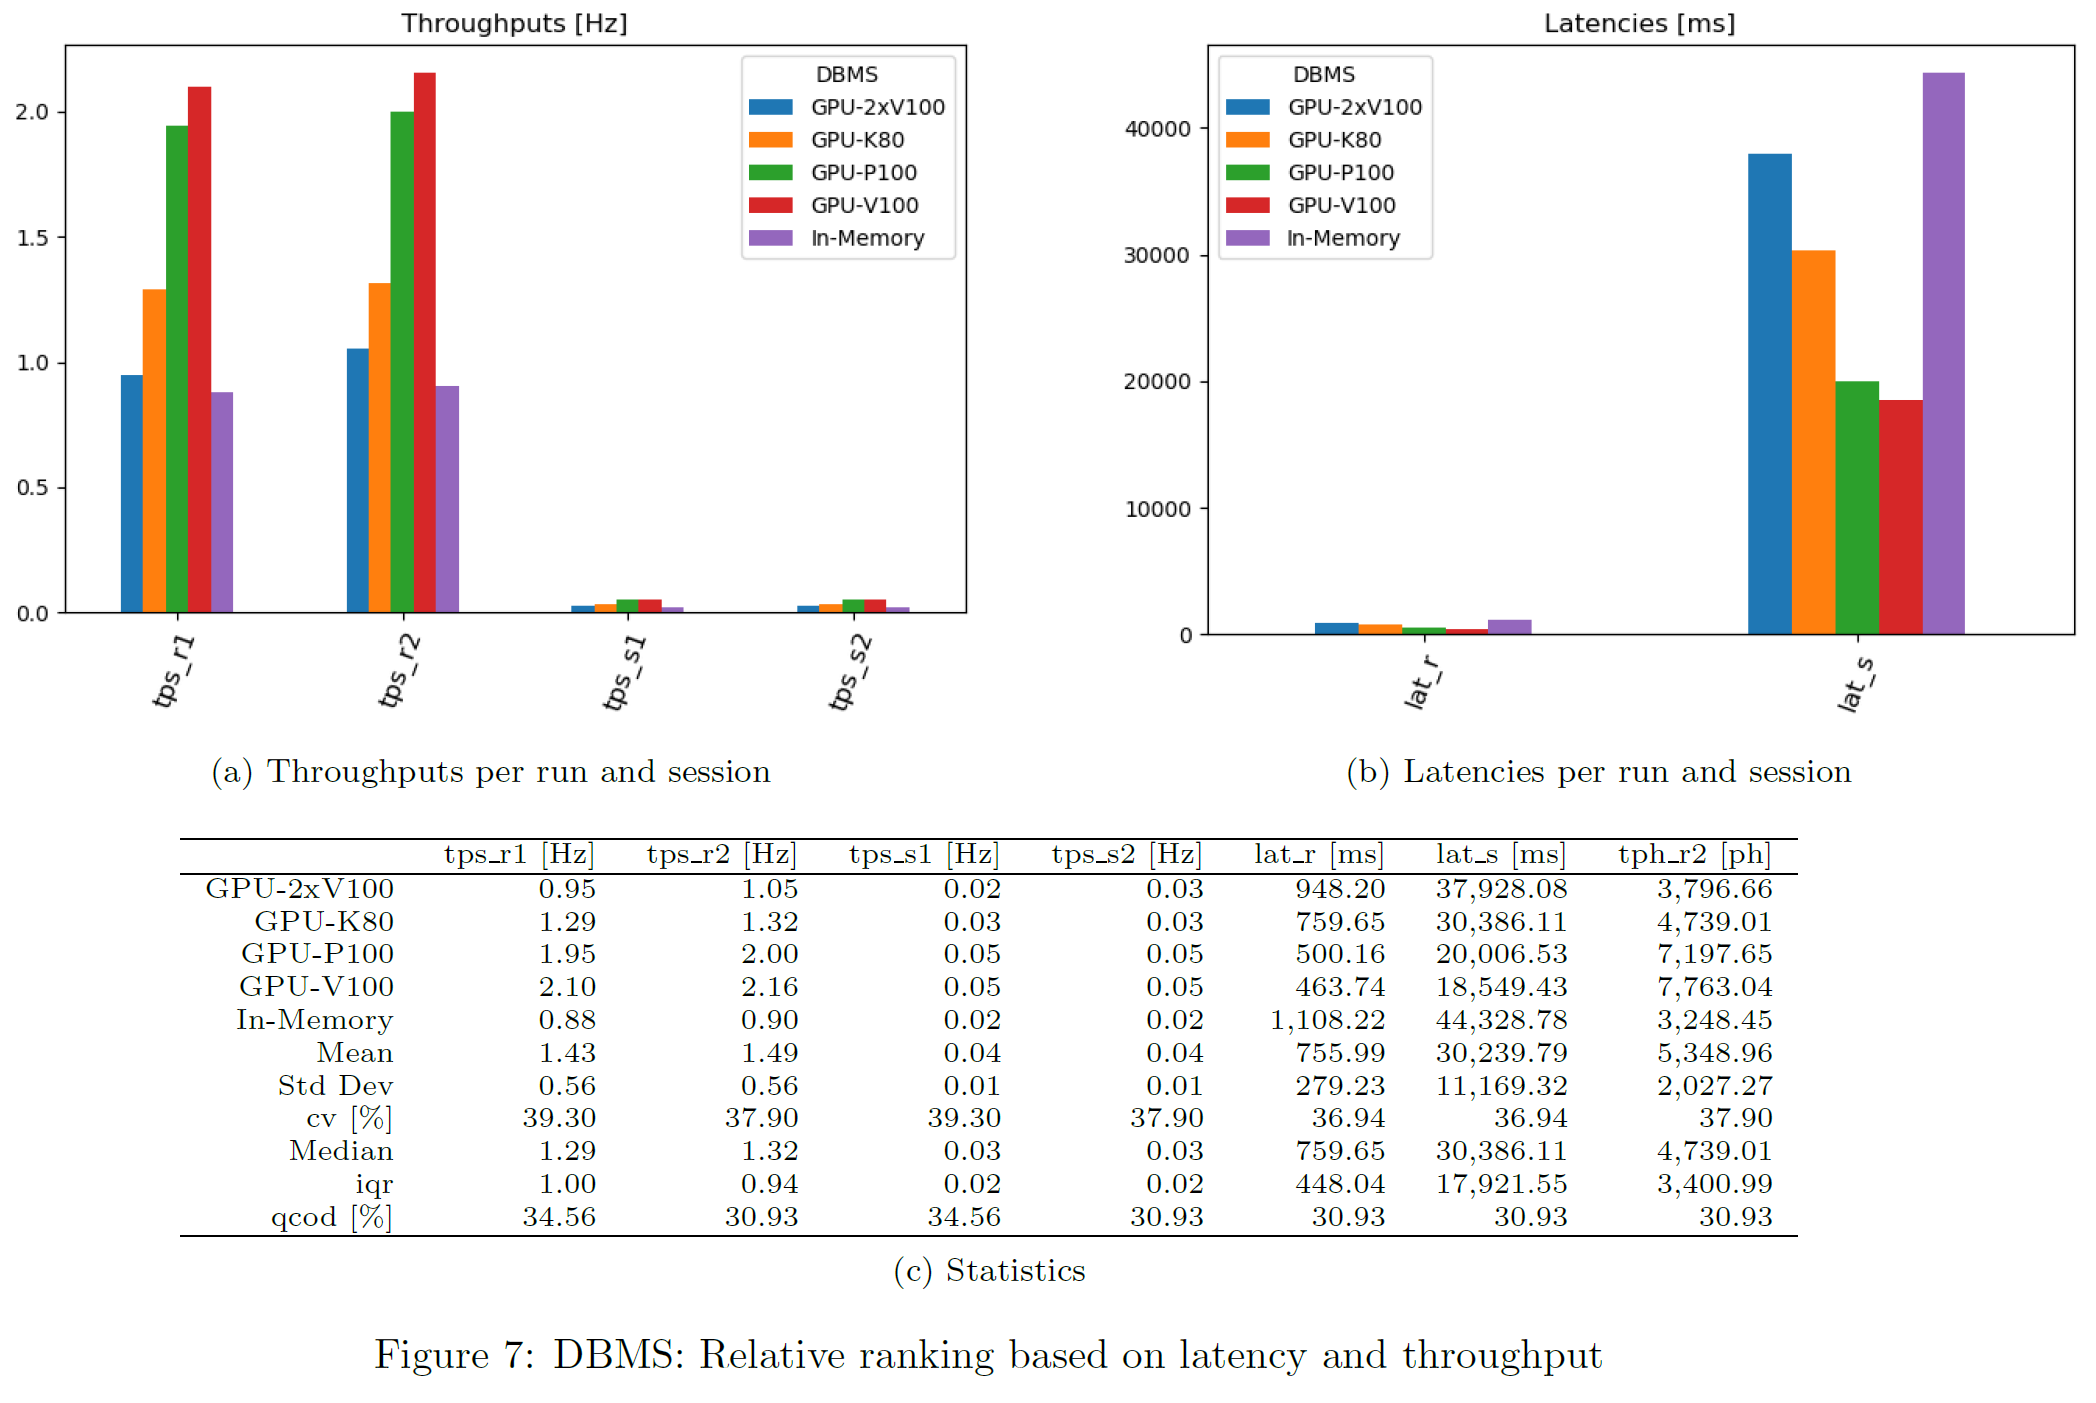
For each query, latency and throughput is computed per DBMS. This chart shows the geometric mean over all queries and per DBMS. Only successful queries and DBMS not producing any error are considered there.
Average Ranking
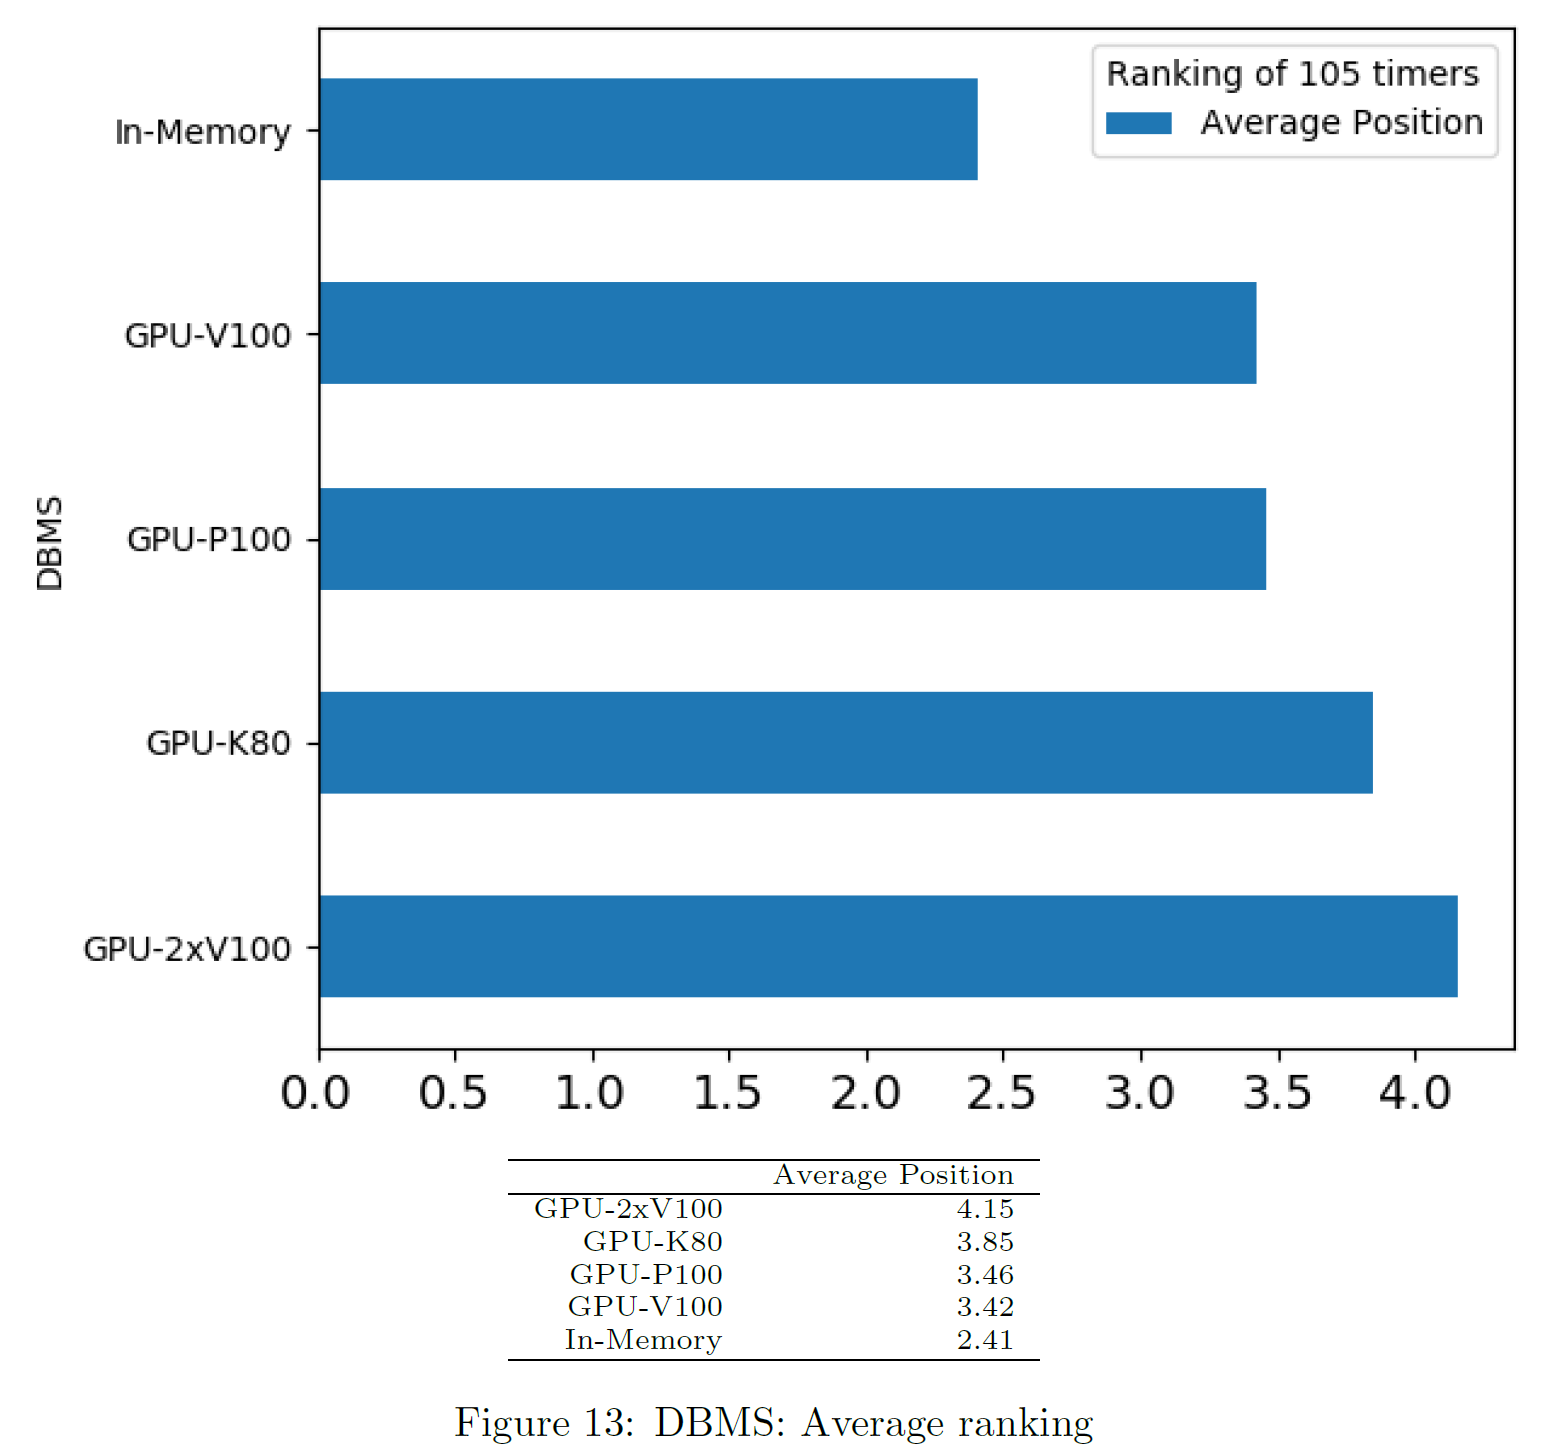
We compute a ranking of DBMS for each query based on the sum of times, from fastest to slowest. Unsuccessful DBMS are considered last place. The chart shows the average ranking per DBMS.
Time of Ingest per DBMS
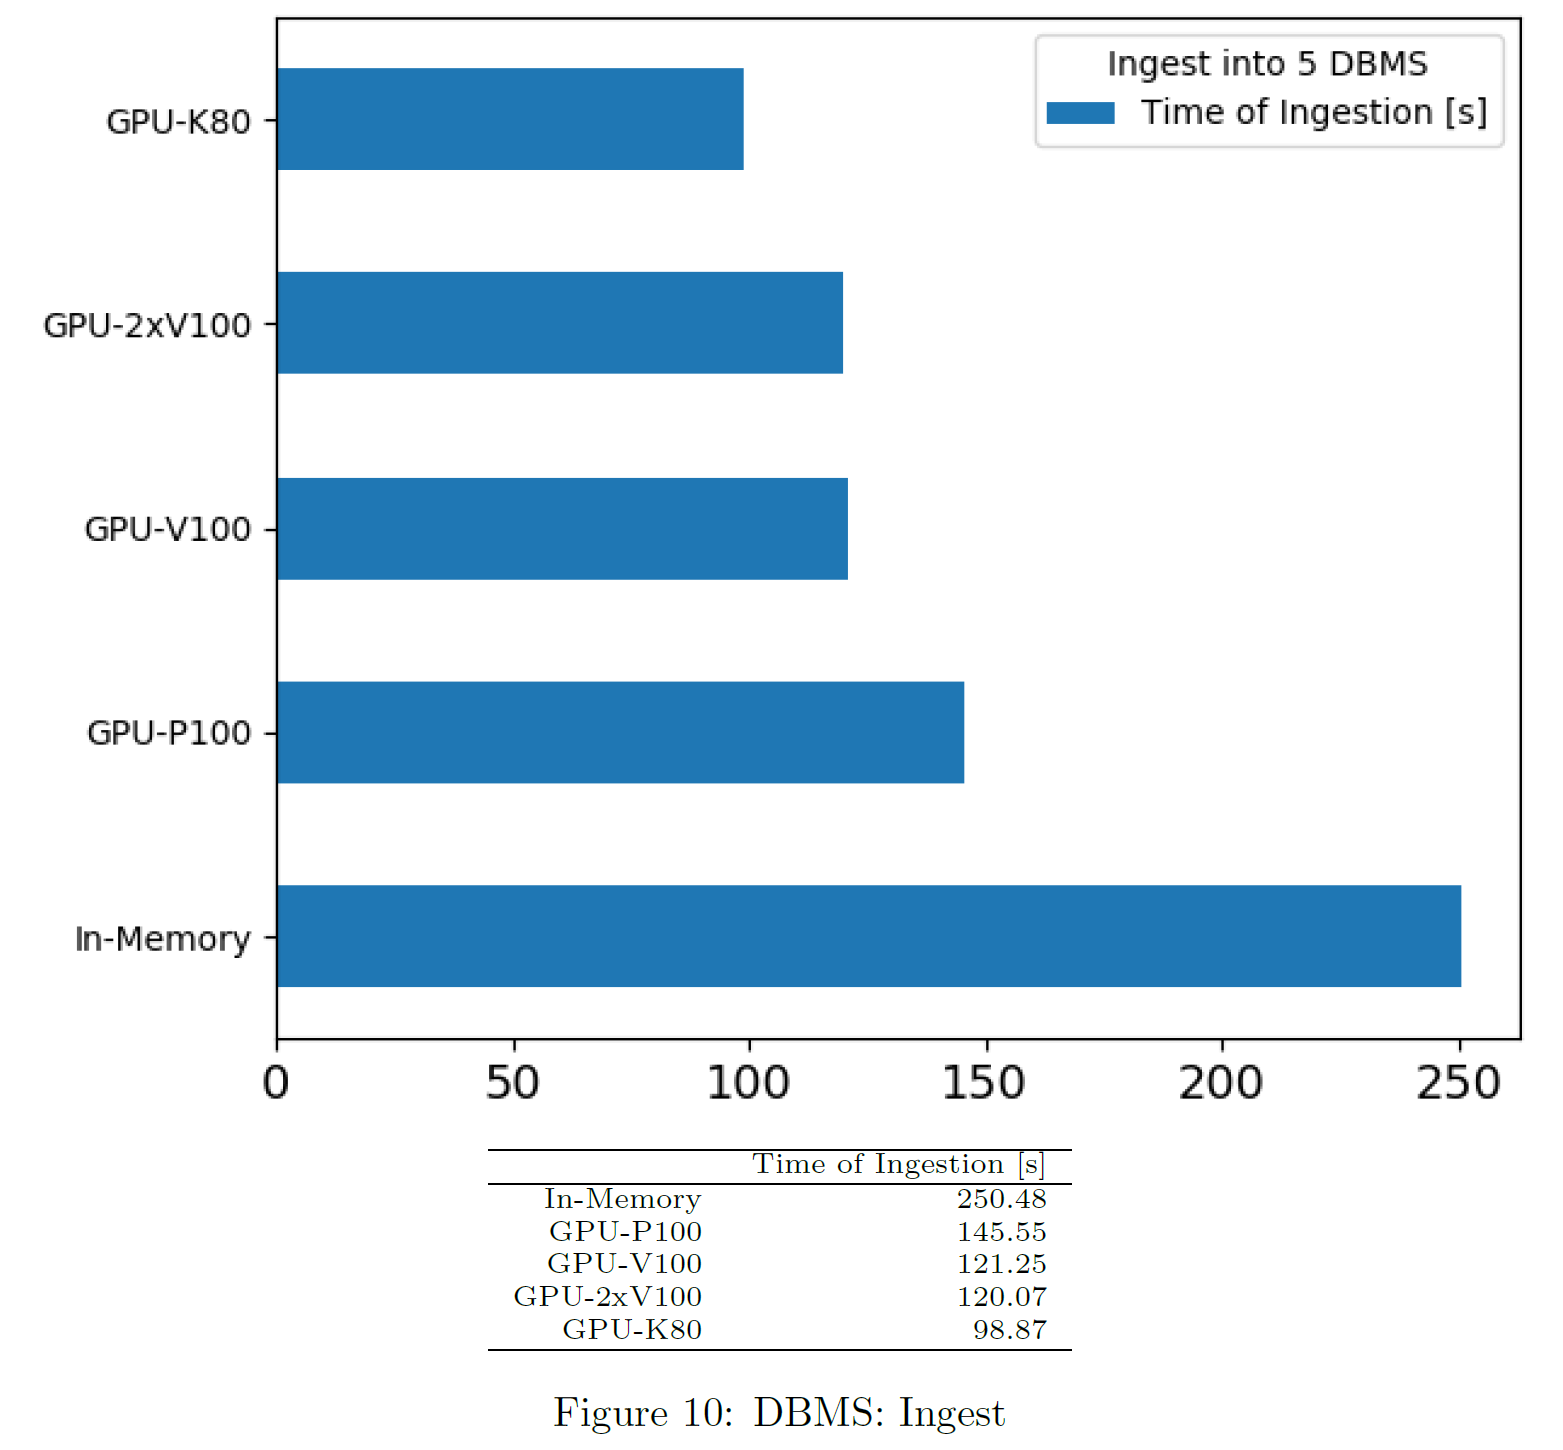
This is part of the informations provided by the user. The tool does not measure time of ingest explicitly.
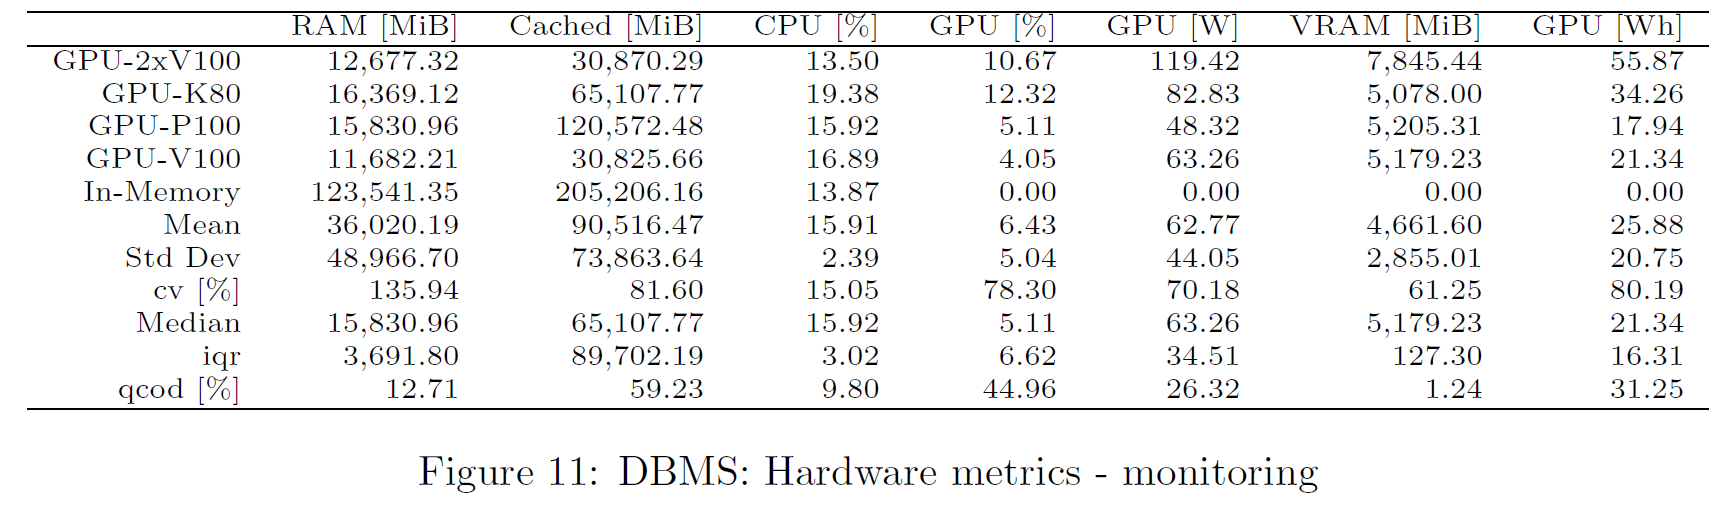
Hardware Metrics
The chart shows the metrics obtained from monitoring. Values are computed as arithmetic mean across benchmarking time. Only successful queries and DBMS not producing any error are considered.
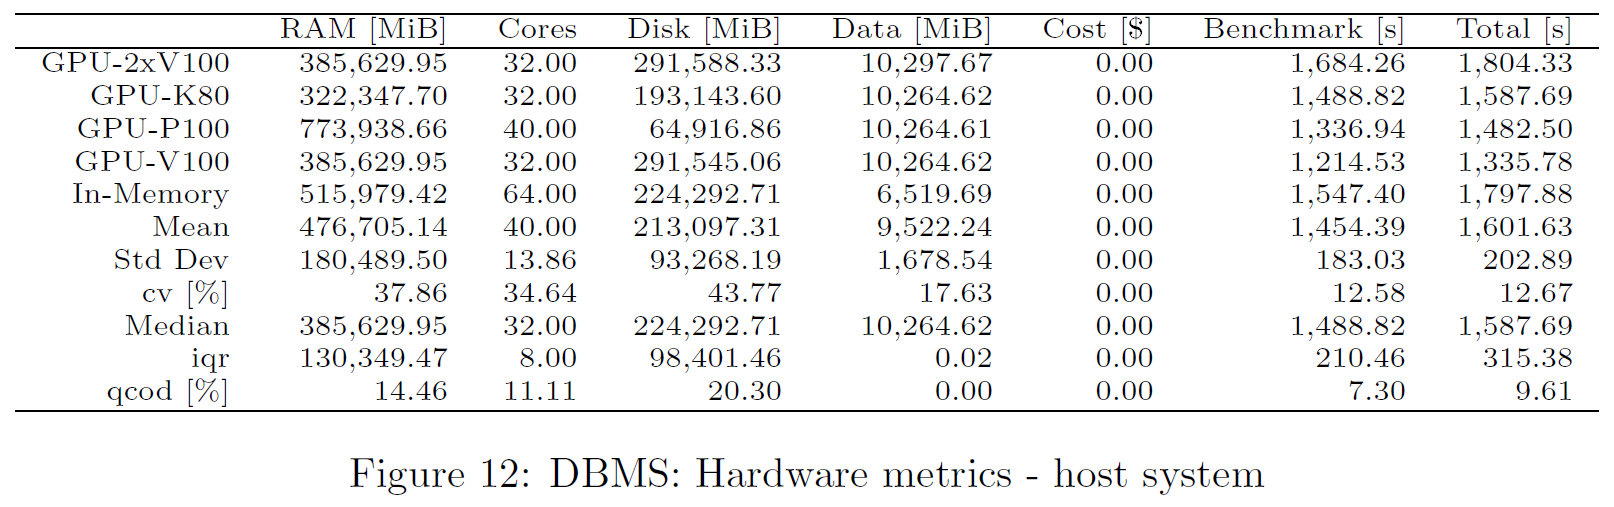
Host Metrics
The host information is provided in the config file. Here, cost is based on the total time.
Drill-Down Timers
Relative Ranking based on Times
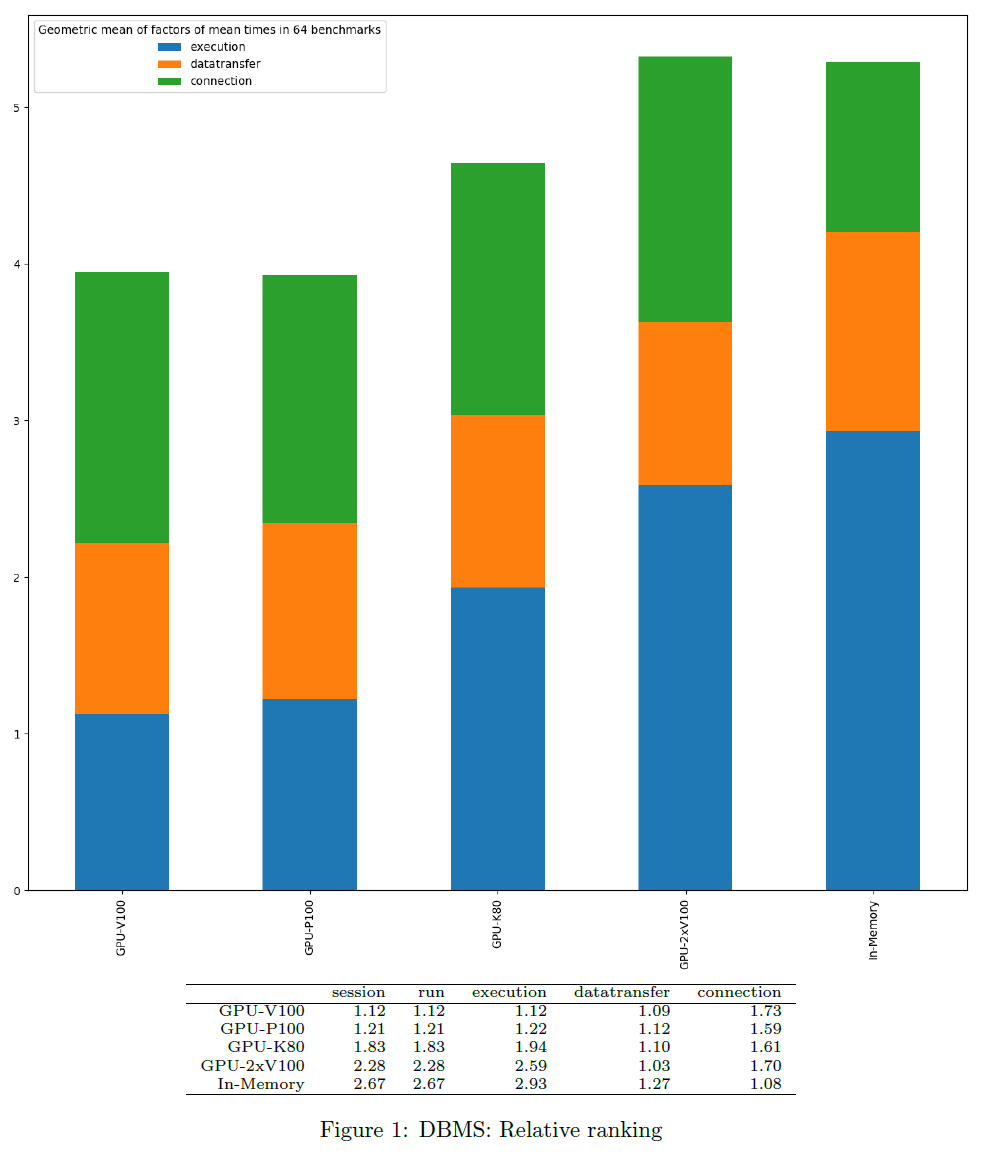
For each query and timer, the best DBMS is considered as gold standard = 100%. Based on their times, the other DBMS obtain a relative ranking factor. Only successful queries and DBMS not producing any error are considered. The chart shows the geometric mean of factors per DBMS.
Average Times
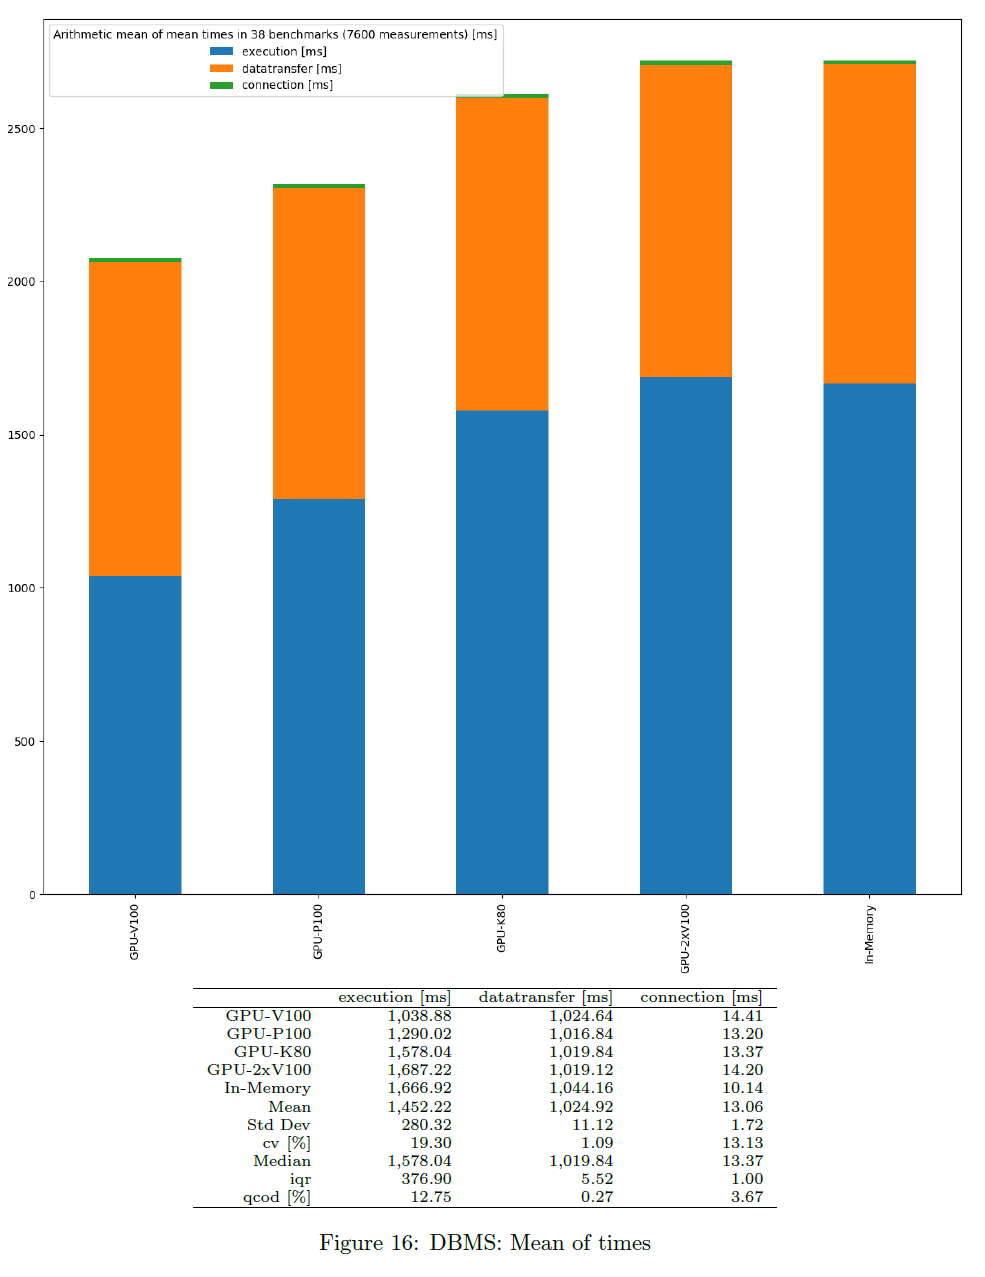
This is based on the mean times of all benchmark test runs. Measurements start before each benchmark run and stop after the same benchmark run has been finished. The average value is computed per query. Parallel benchmark runs should not slow down in an ideal situation. Only successful queries and DBMS not producing any error are considered. The chart shows the average of query times based on mean values per DBMS and per timer.
Note that the mean of mean values (here) is in general not the same as mean of all runs (different queries may have different number of runs).
Slice Timers
Heatmap of Factors
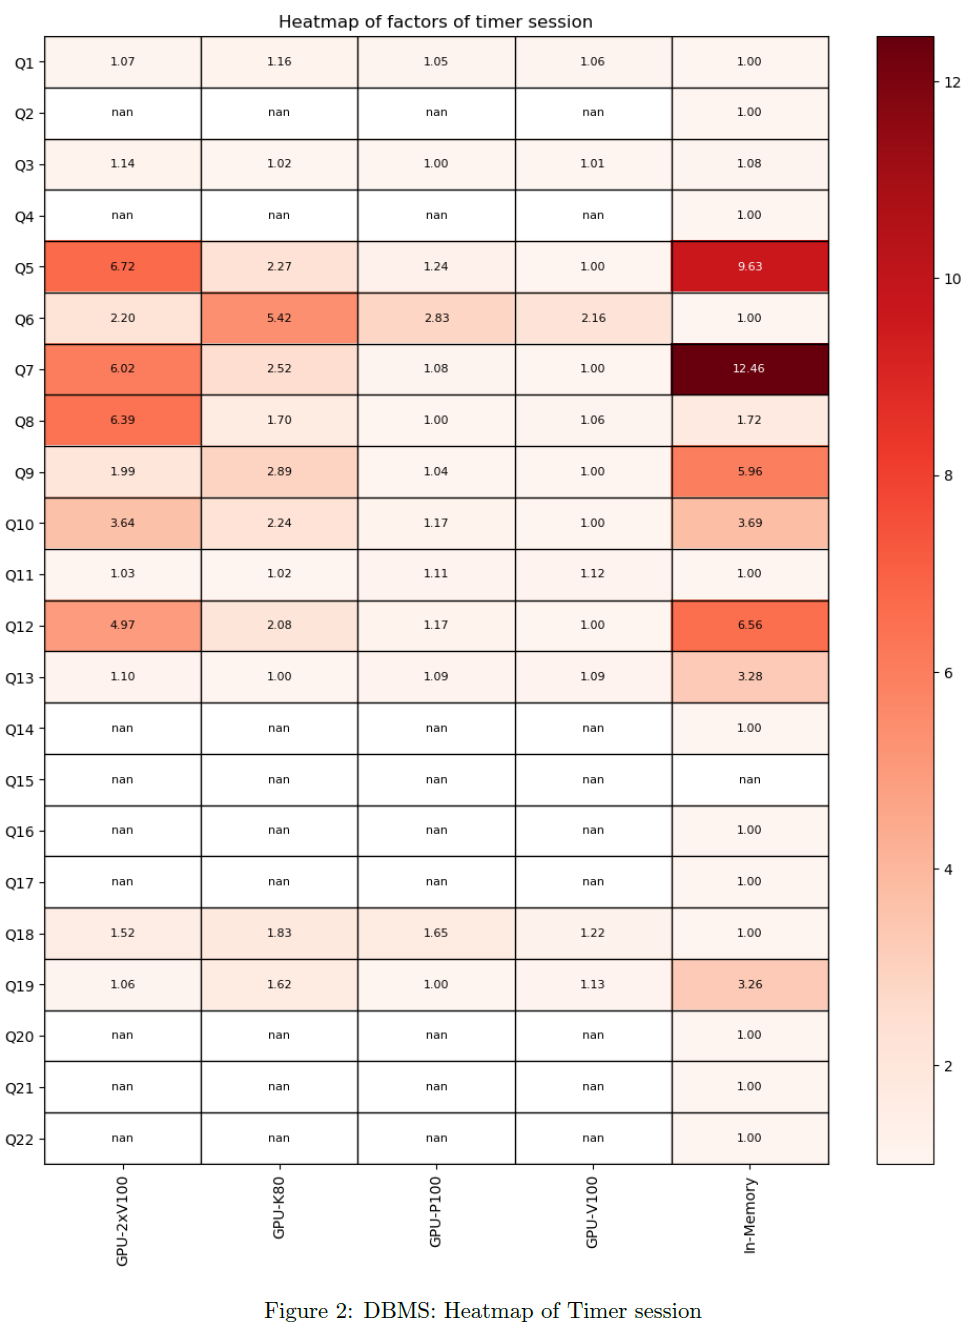
The relative ranking can be refined to see the contribution of each query. The chart shows the factor of the corresponding timer per query and DBMS. All active queries and DBMS are considered.
Drill-Down Queries
Total Times
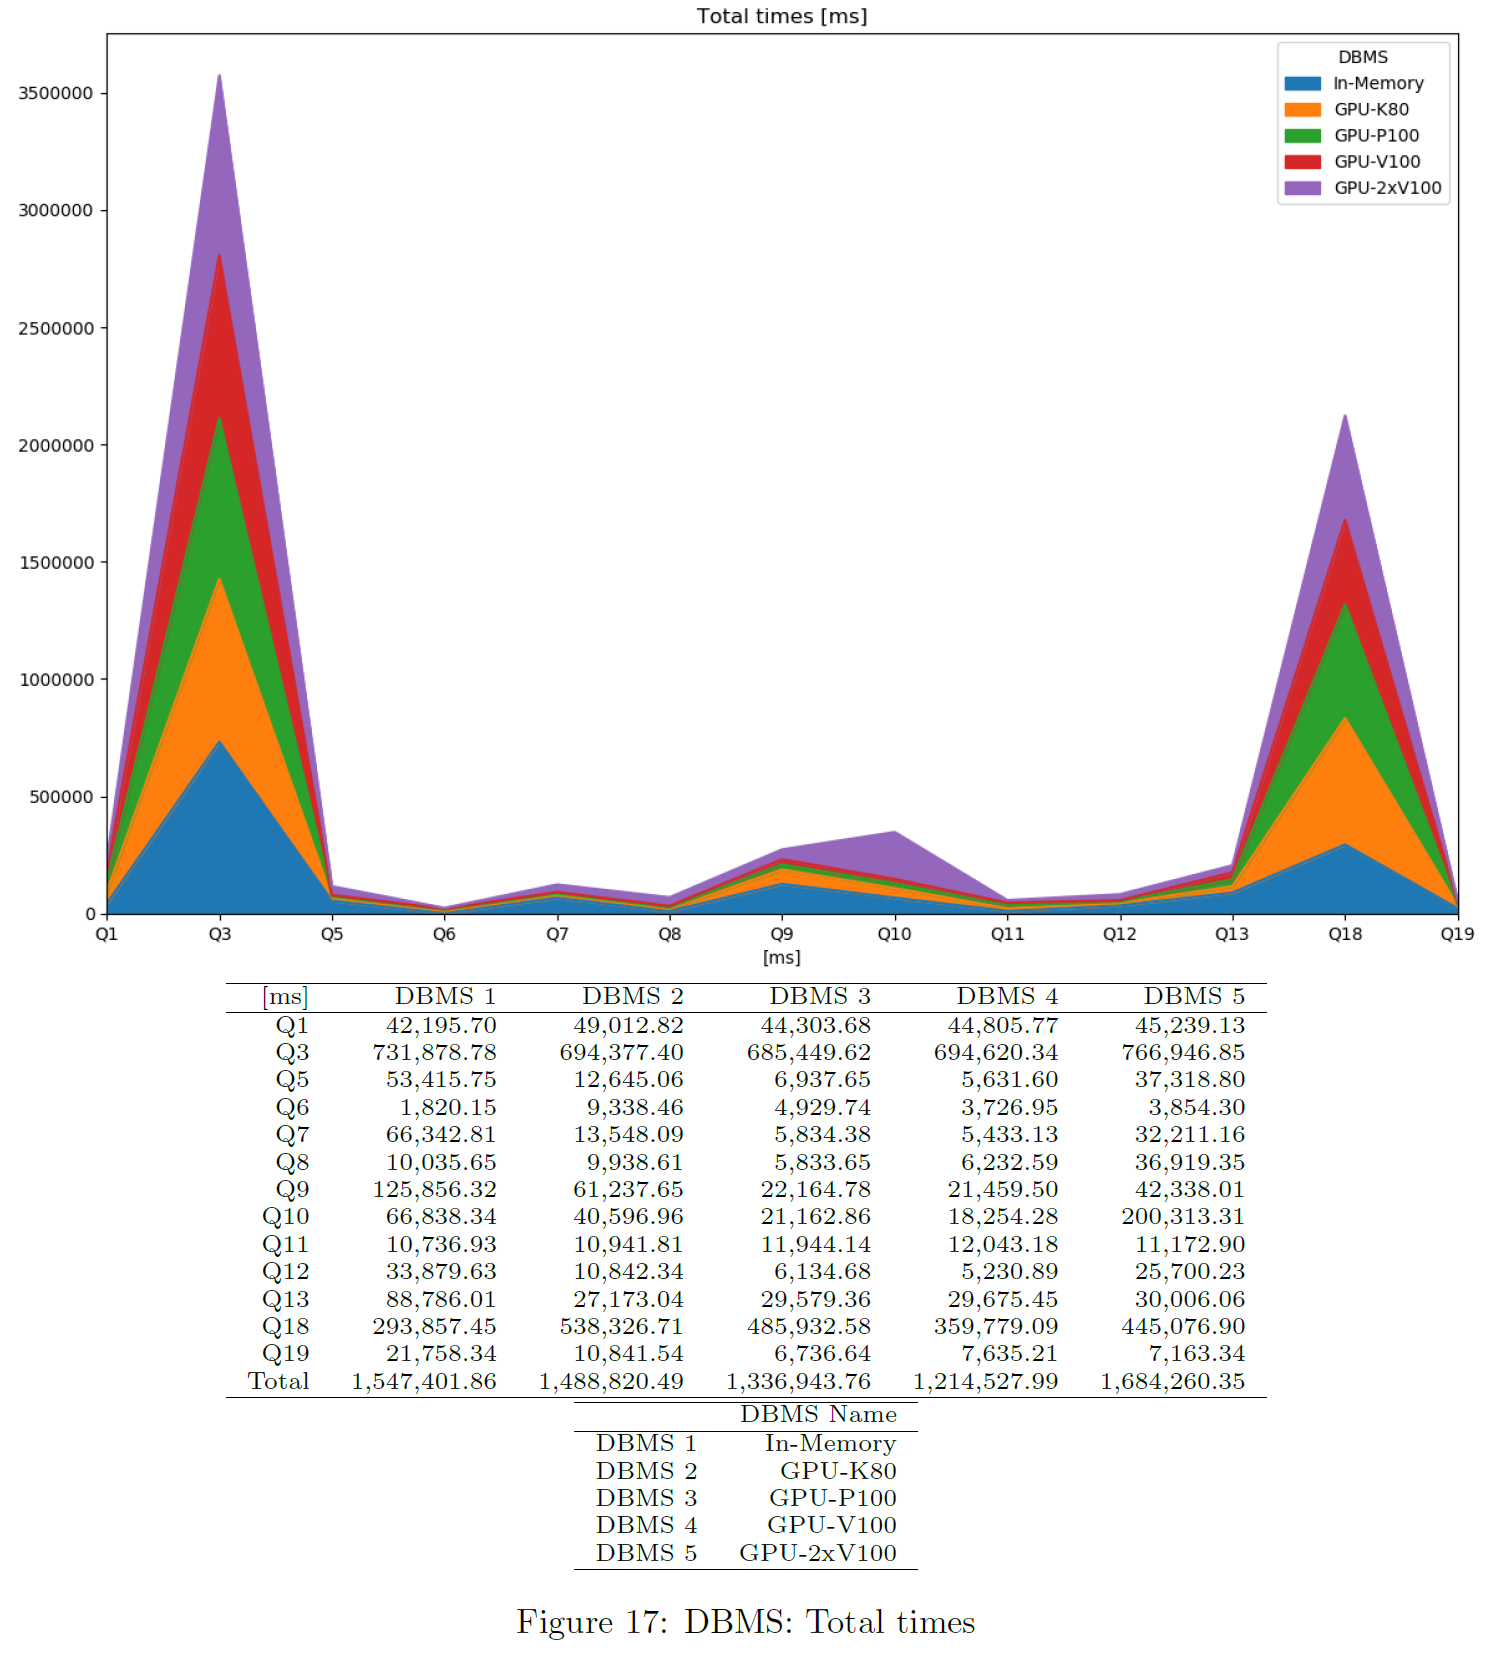
This is based on the times each DBMS is queried in total. Measurement starts before first benchmark run and stops after the last benchmark run has been finished. Parallel benchmarks should speed up the total time in an ideal situation. Only successful queries and DBMS not producing any error are considered. Note this also includes the time needed for sorting and storing result sets etc. The chart shows the total query time per DBMS and query.
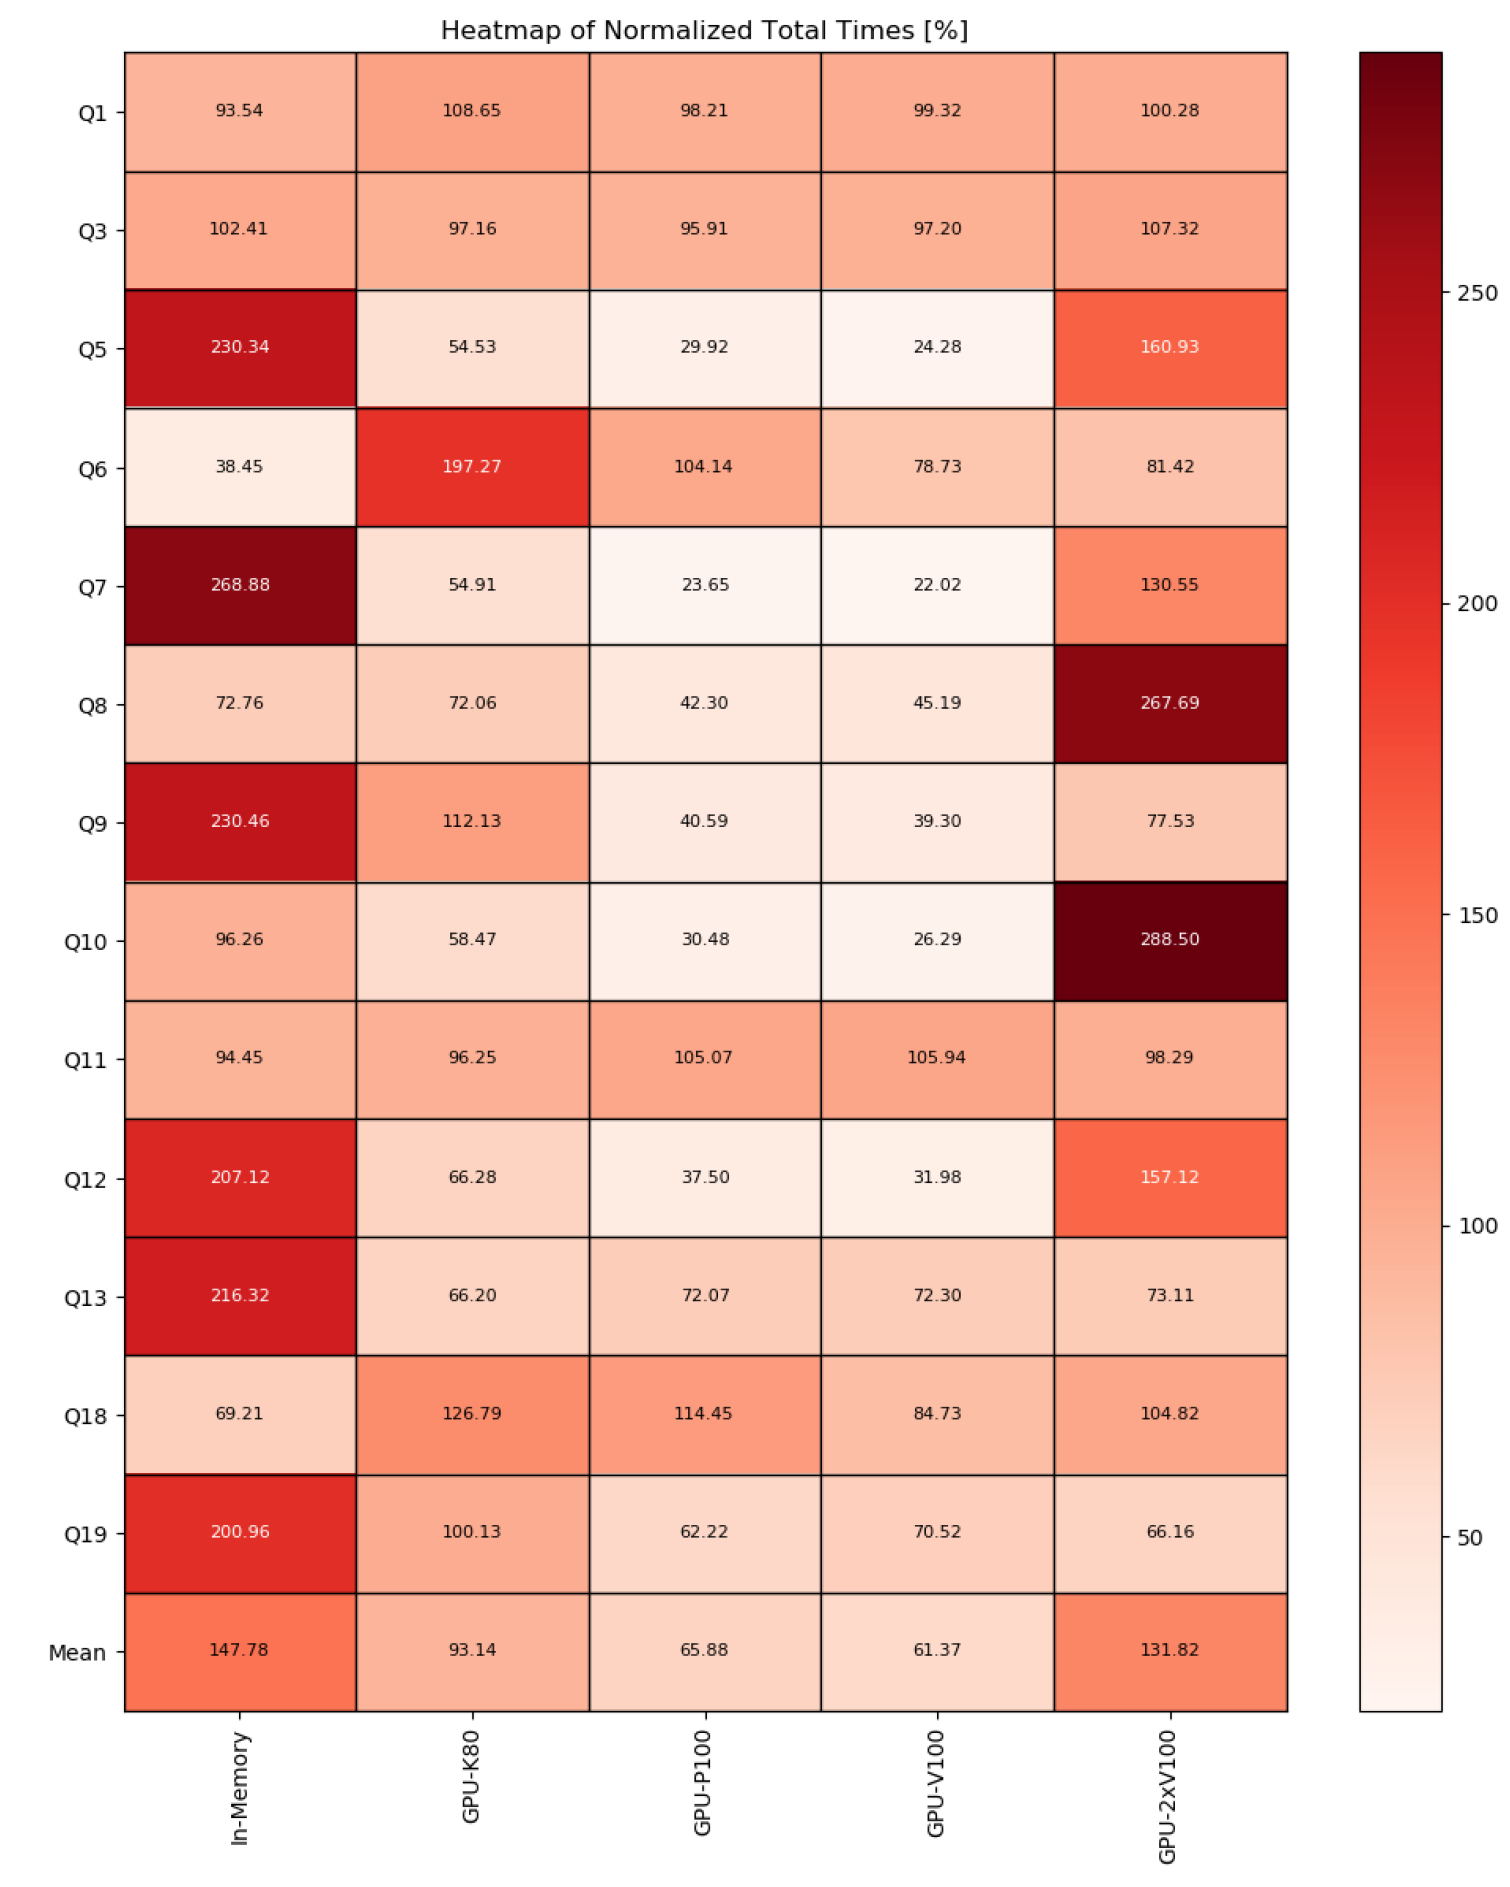
Normalized Total Times
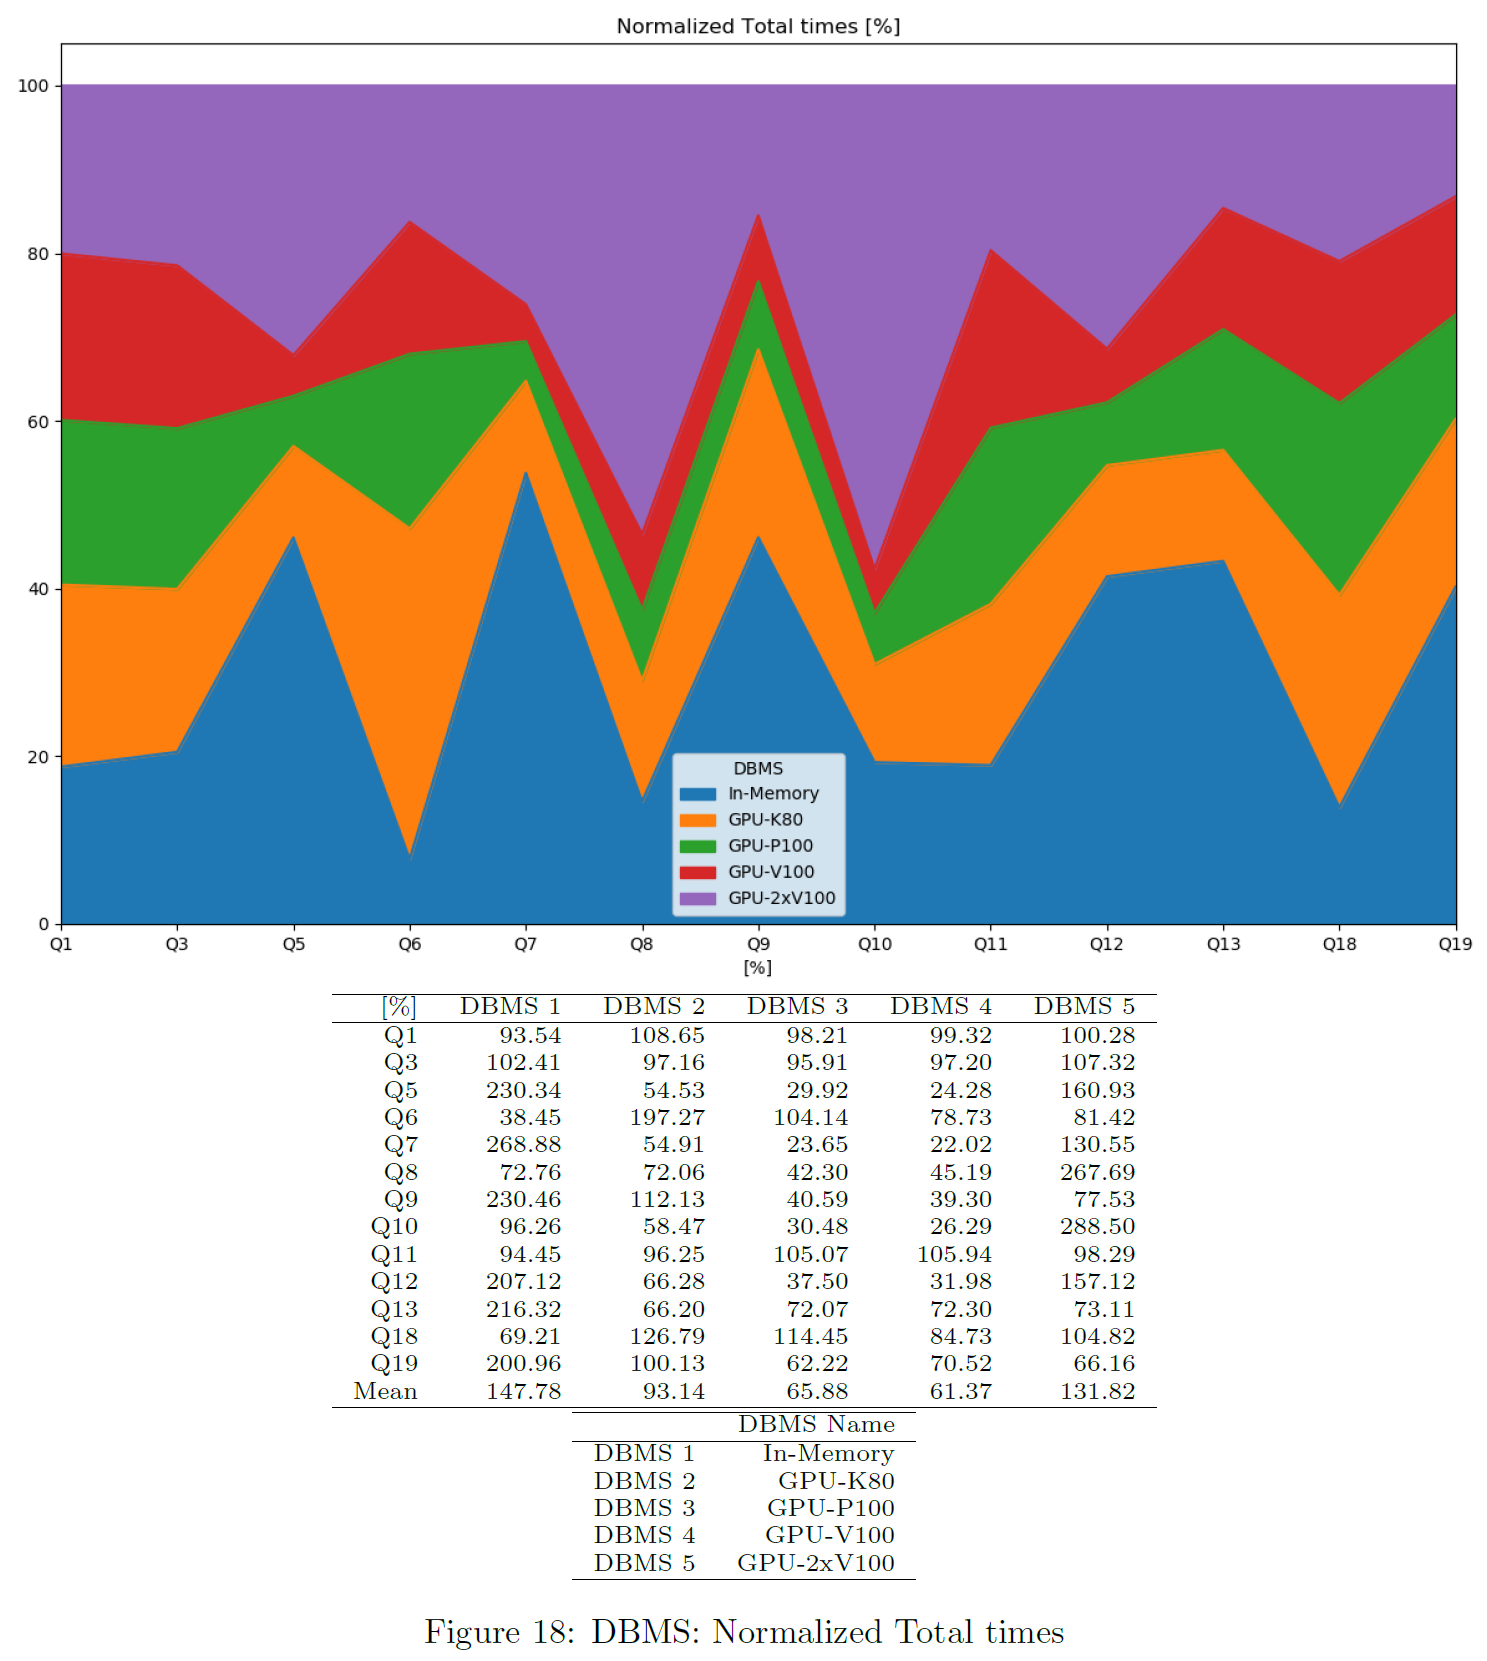
The chart shows total times per query, normalized to the average total time of that query. Only successful queries and DBMS not producing any error are considered. This is also available as a heatmap.
Throughputs
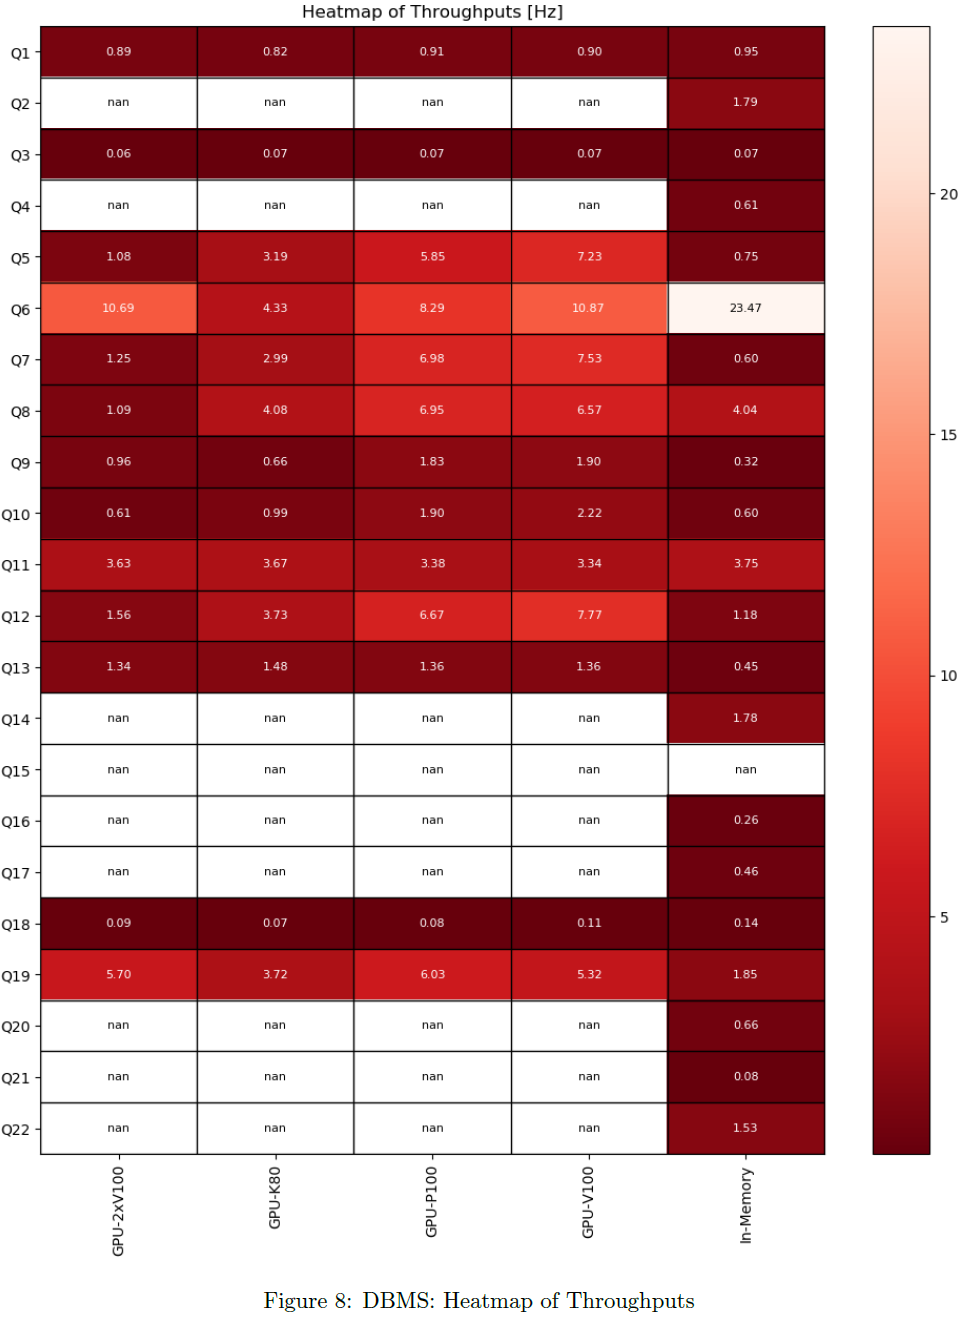
For each query, latency and throughput is computed per DBMS. Only successful queries and DBMS not producing any error are considered there.
Latencies
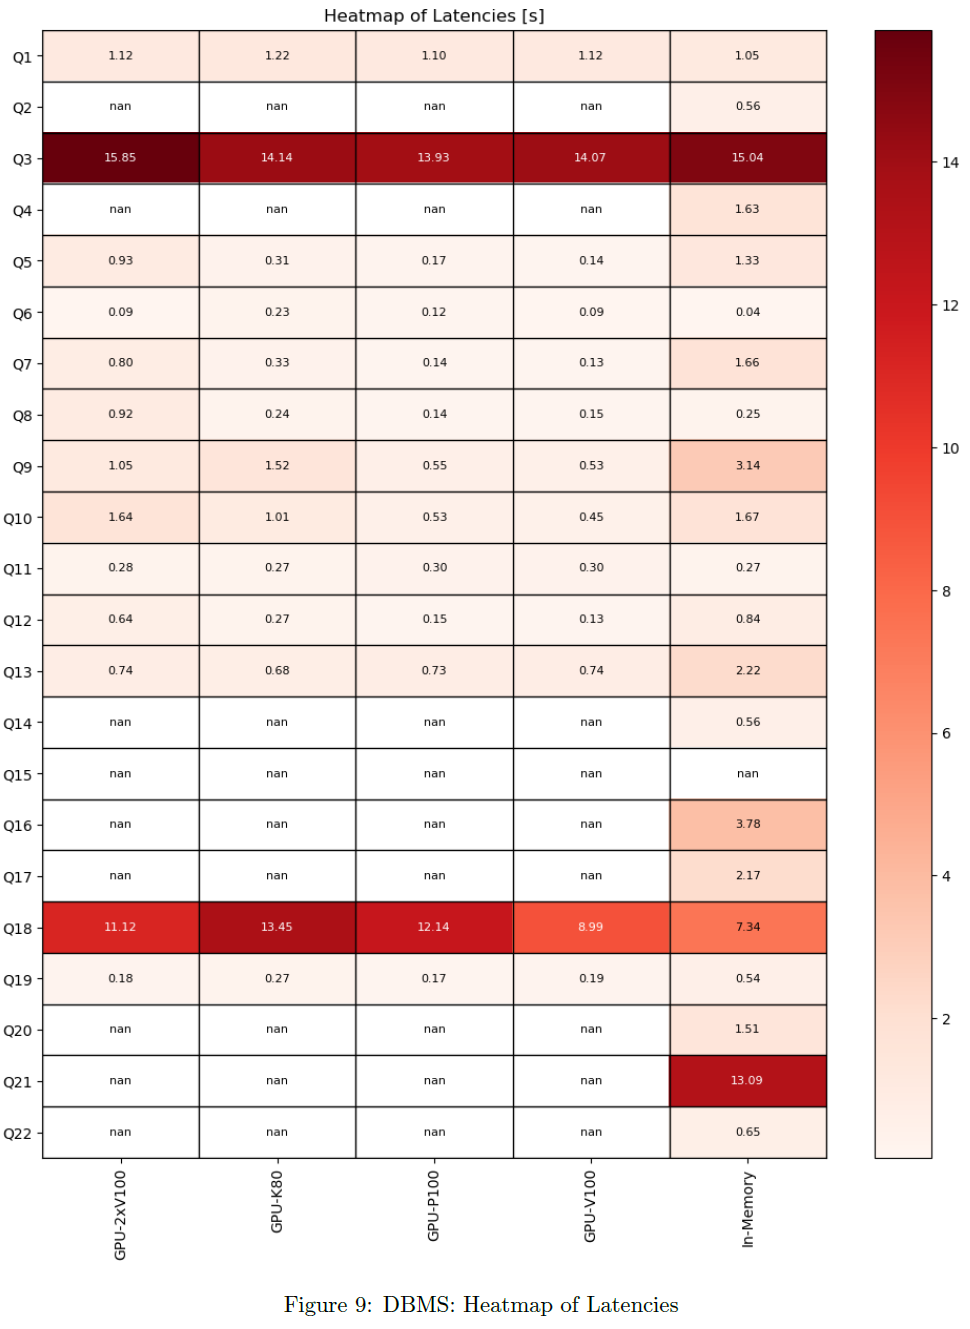
For each query, latency and throughput is computed per DBMS. Only successful queries and DBMS not producing any error are considered there.
Sizes of Result Sets
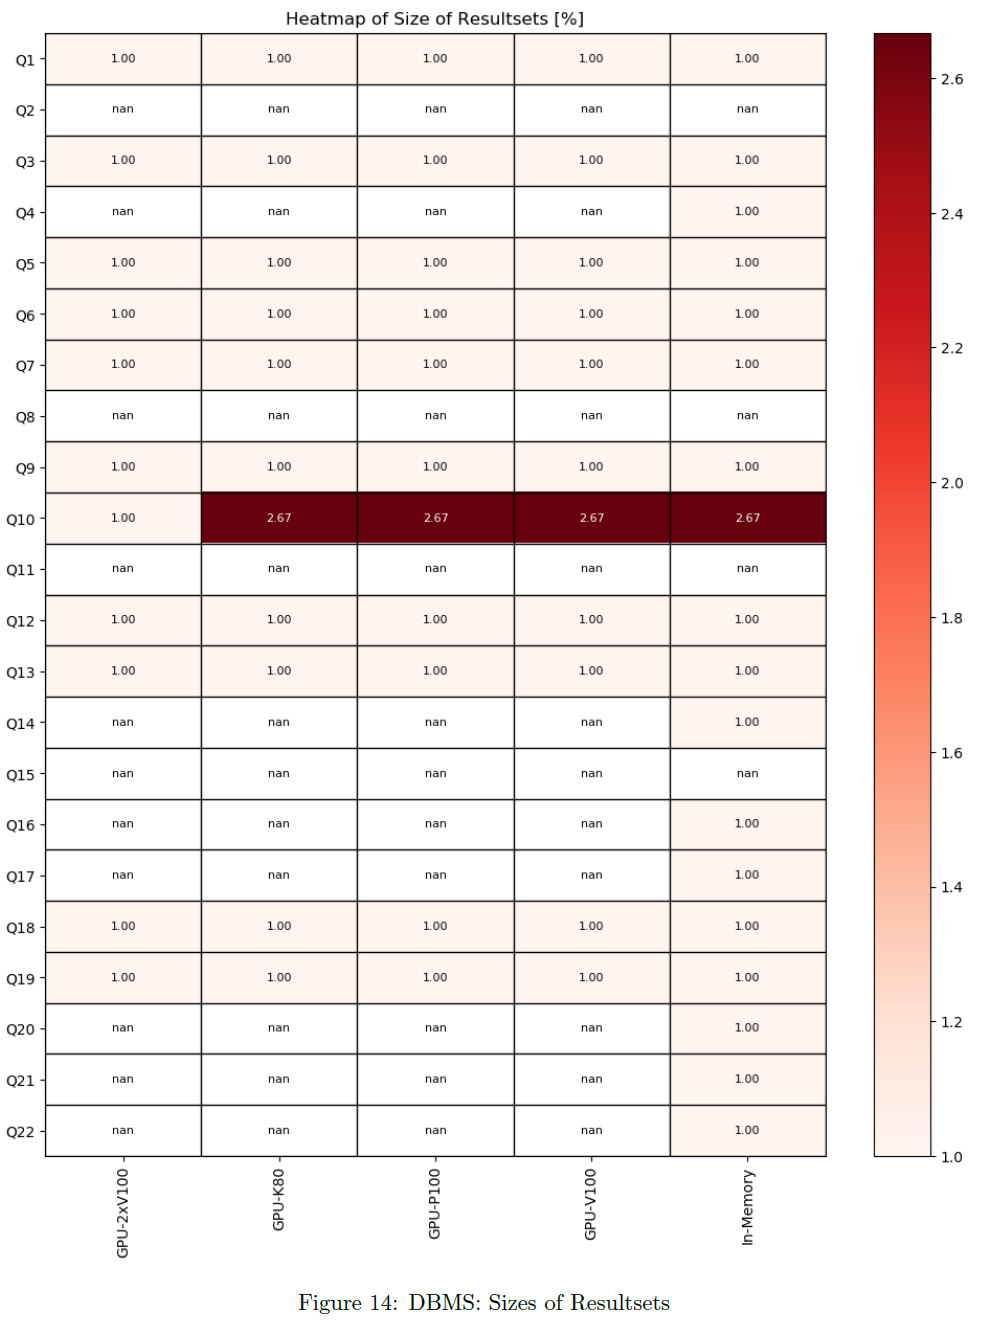
For each query, the size of received data per DBMS is stored. The chart shows the size of result sets per DBMS and per timer. Sizes are normalized to minimum per query. All active queries and DBMS are considered.
Errors
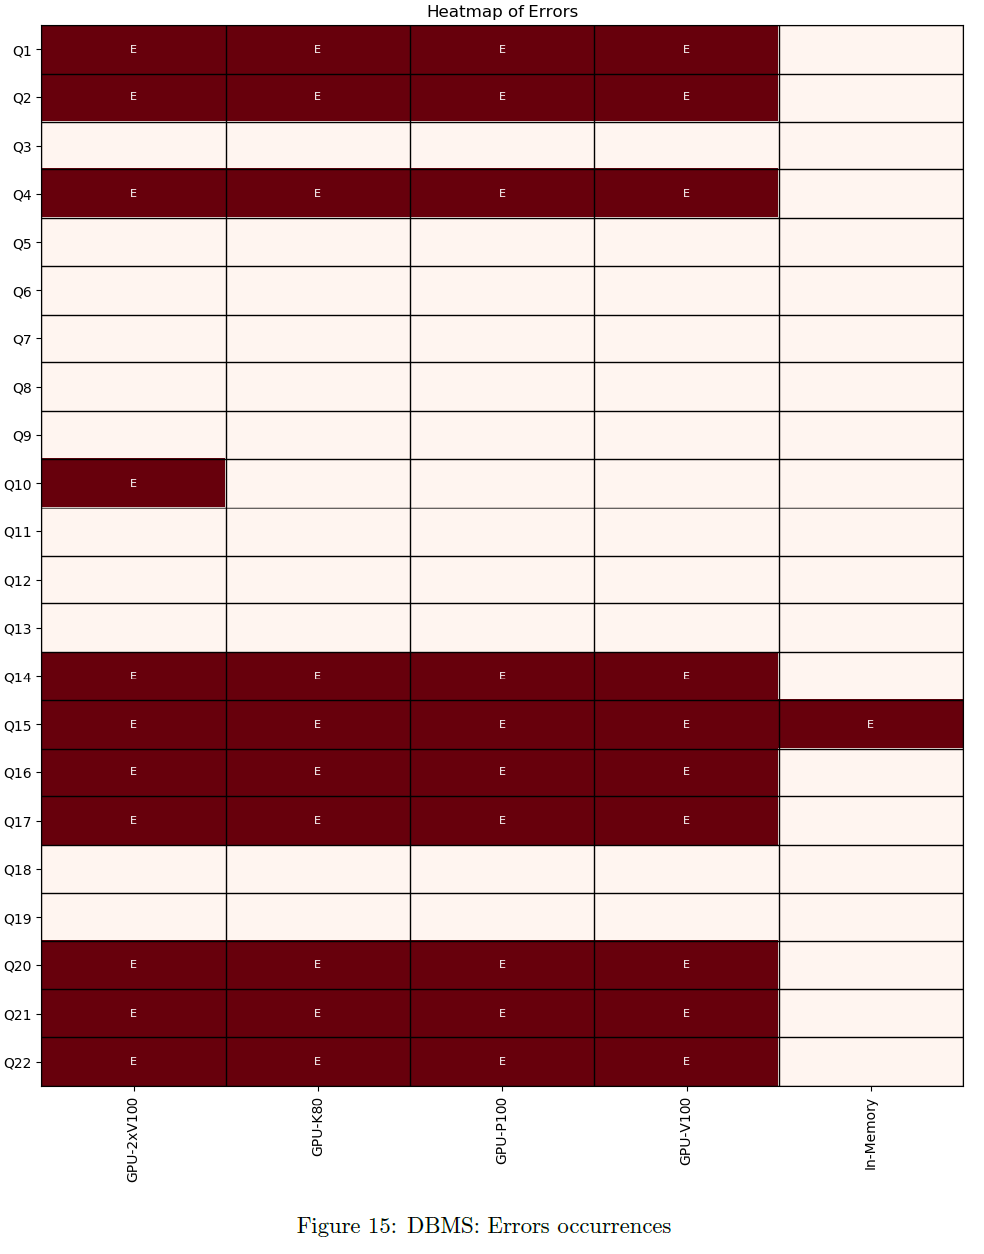
The chart shows per DBMS and per timer, if an error has occured. All active queries and DBMS are considered.
Warnings
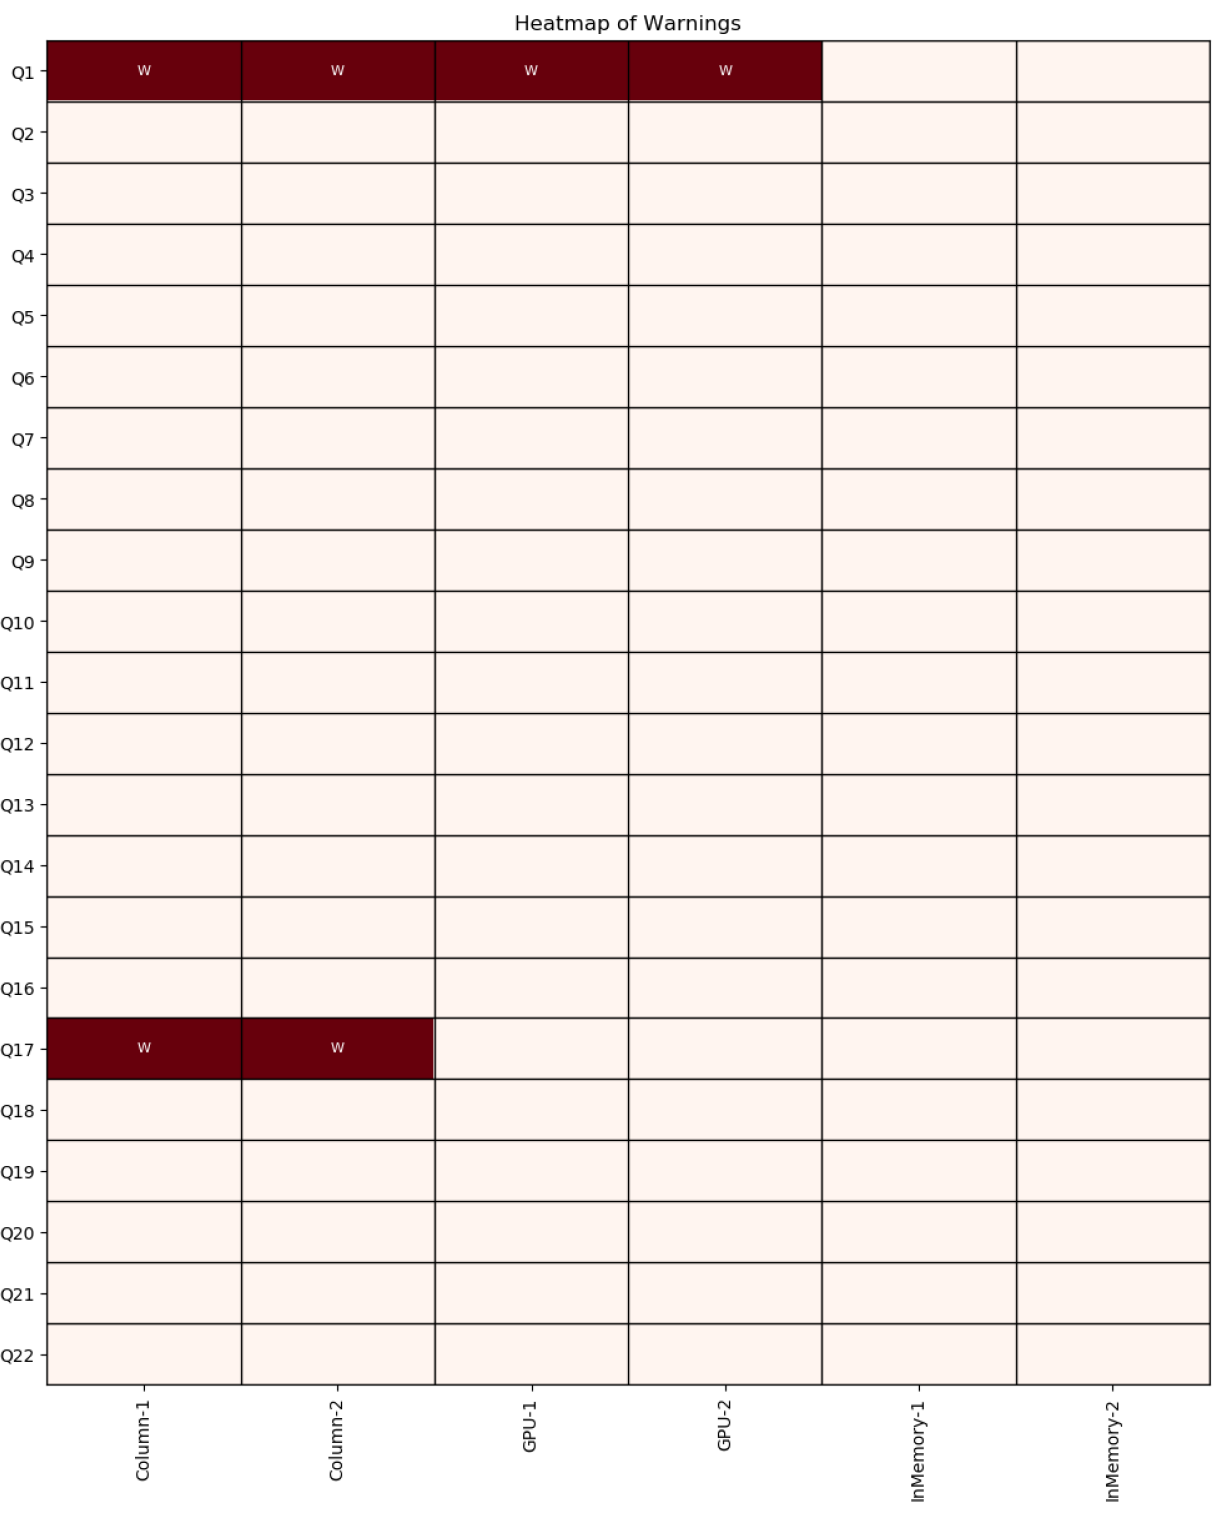
The chart shows per DBMS and per timer, if a warning has occured. All active queries and DBMS are considered.
Slice Queries
Latency and Throughput per Query
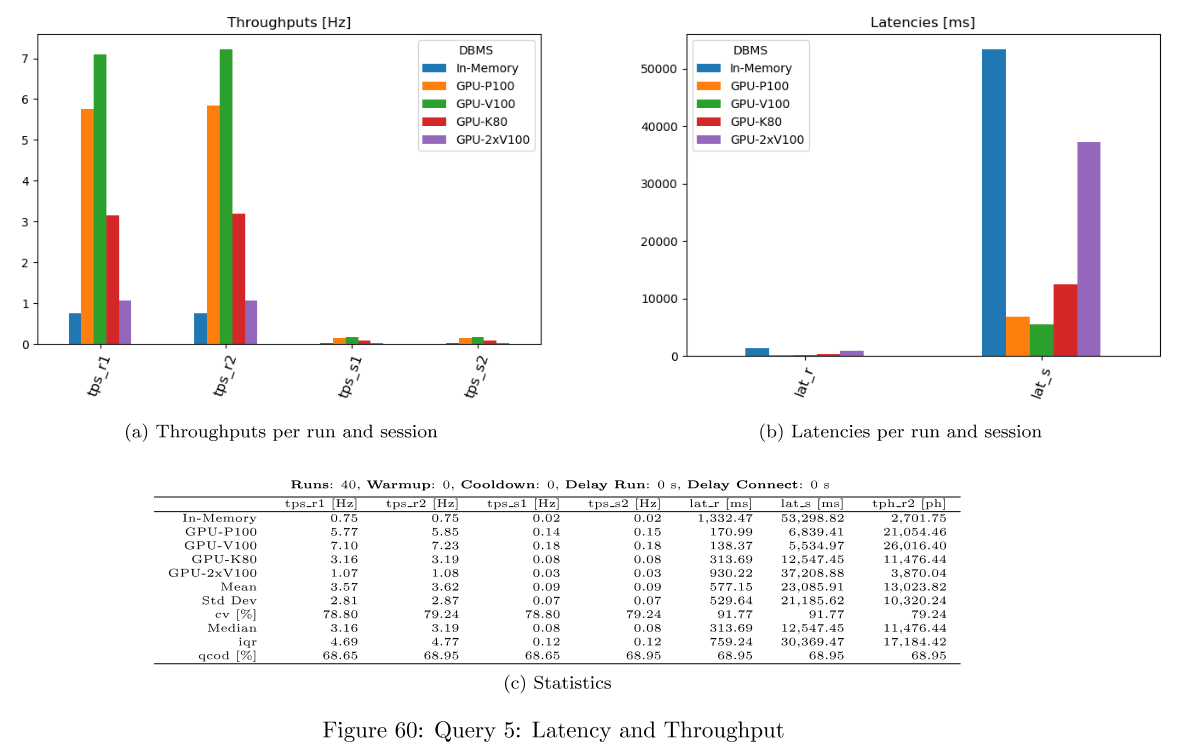
For each query, latency and throughput is computed per DBMS. This is available as dataframes, in the evaluation dict and as png files per query. Only successful queries and DBMS not producing any error are considered there.
Hardware Metrics per Query
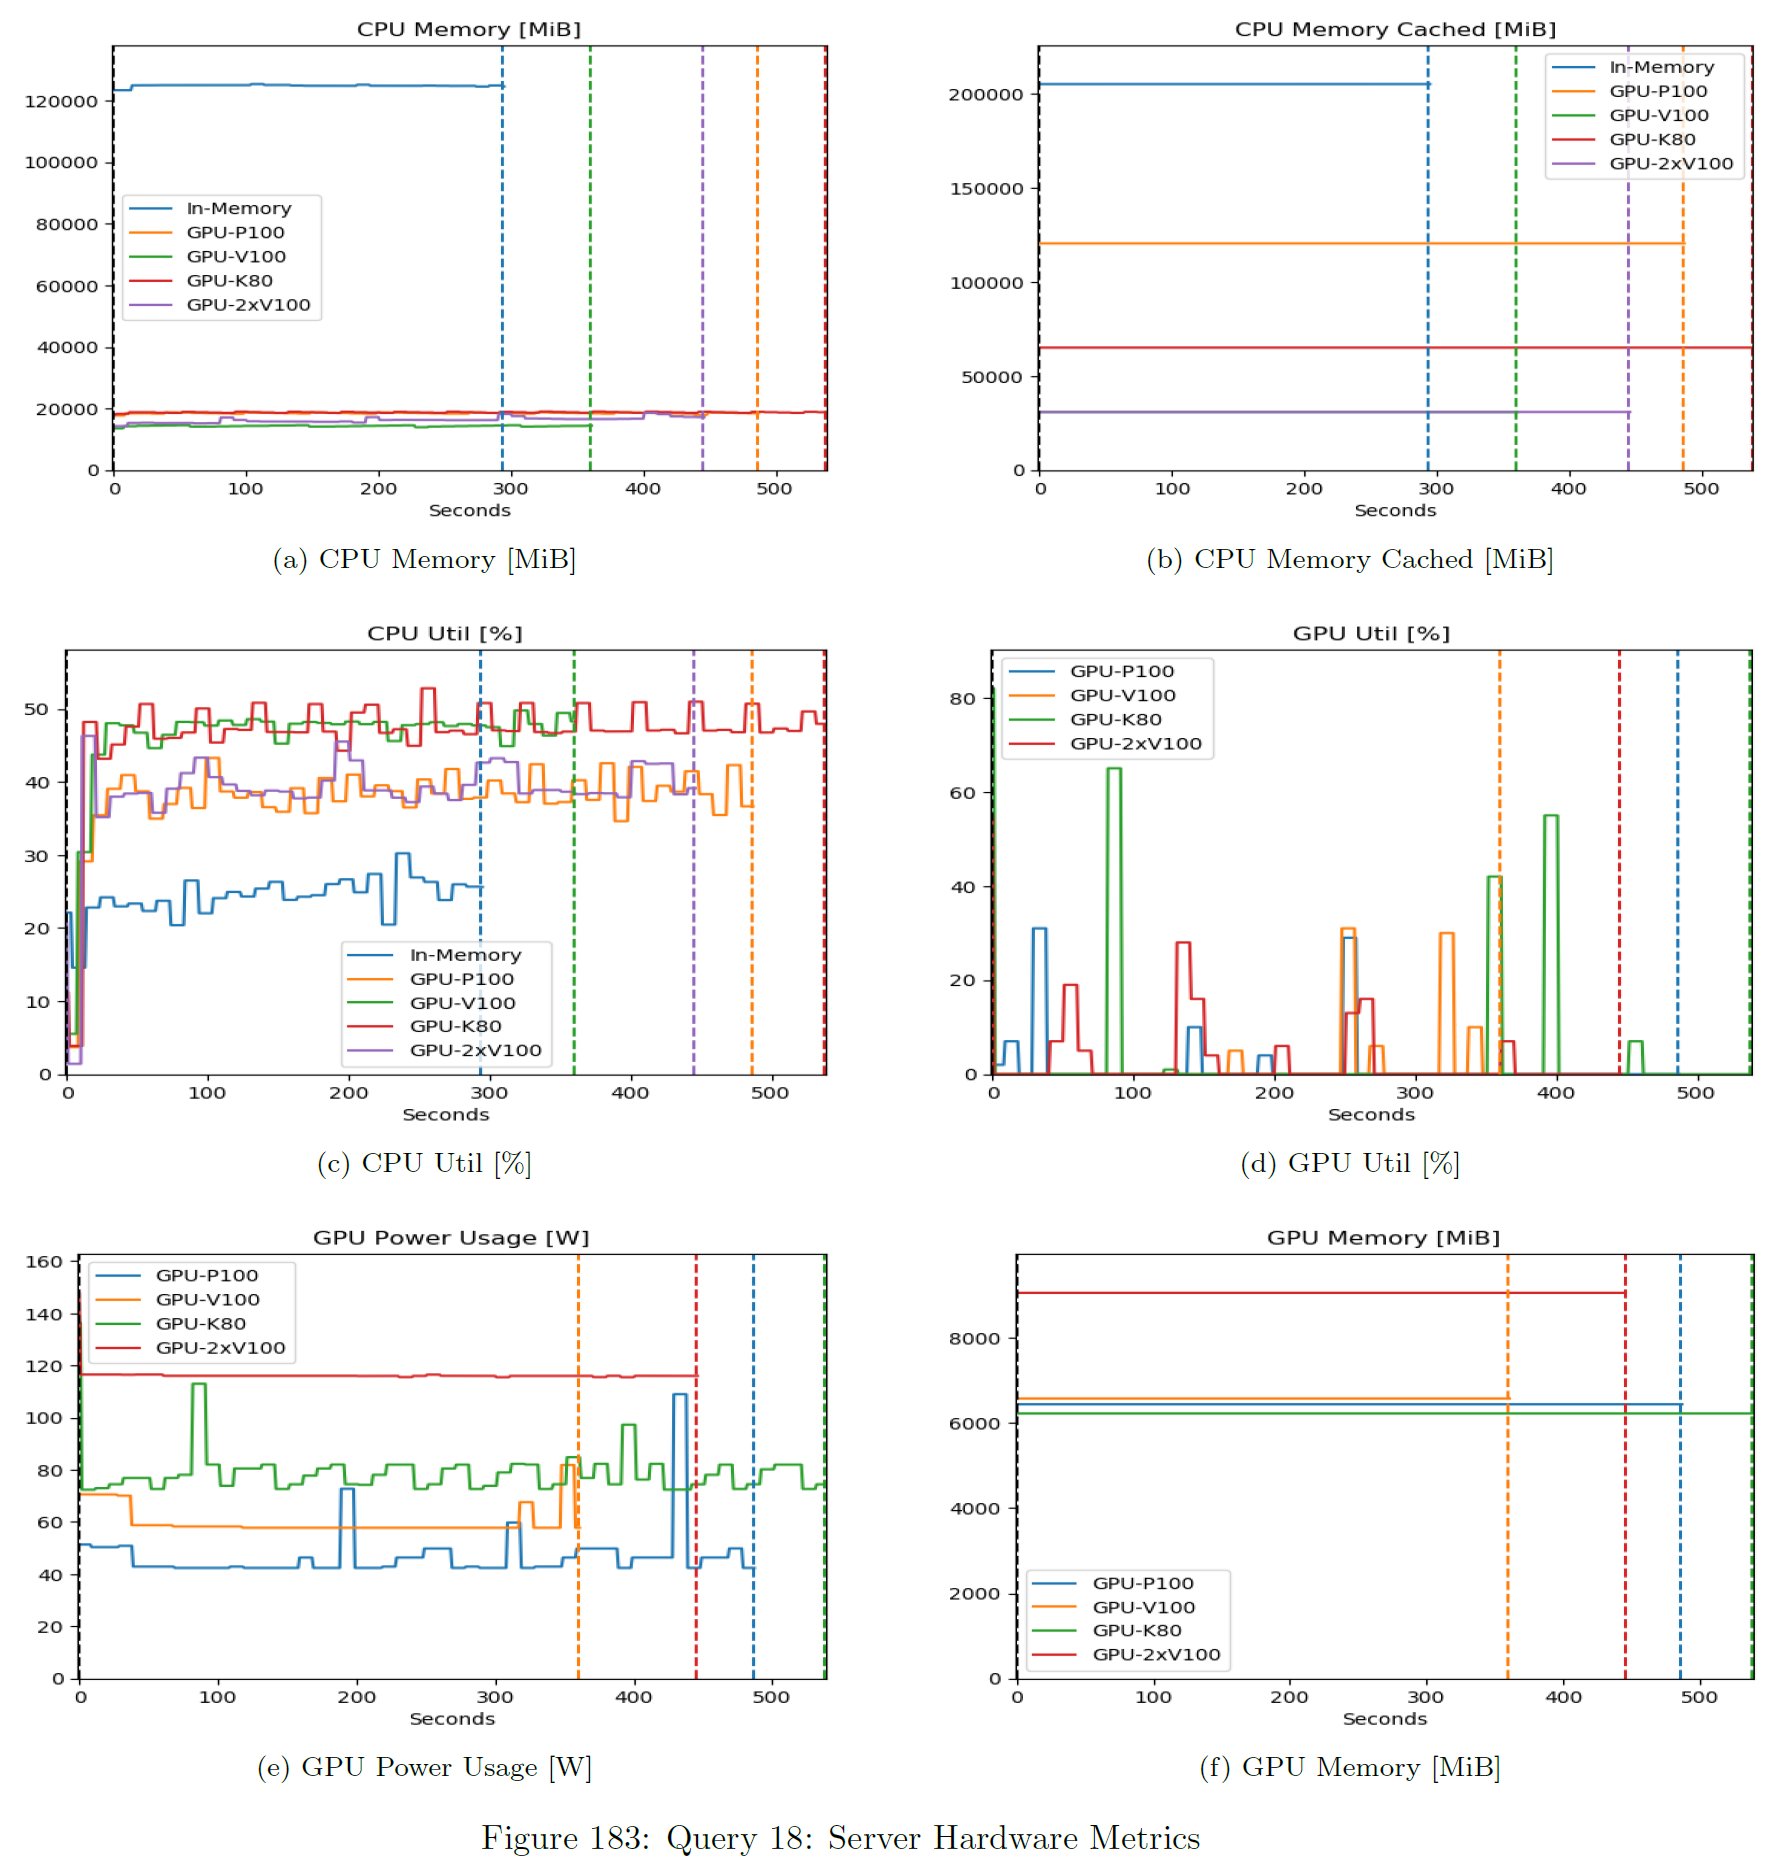
These metrics are collected from a Prometheus / Grafana stack. This expects time-synchronized servers.
Timers Per Query
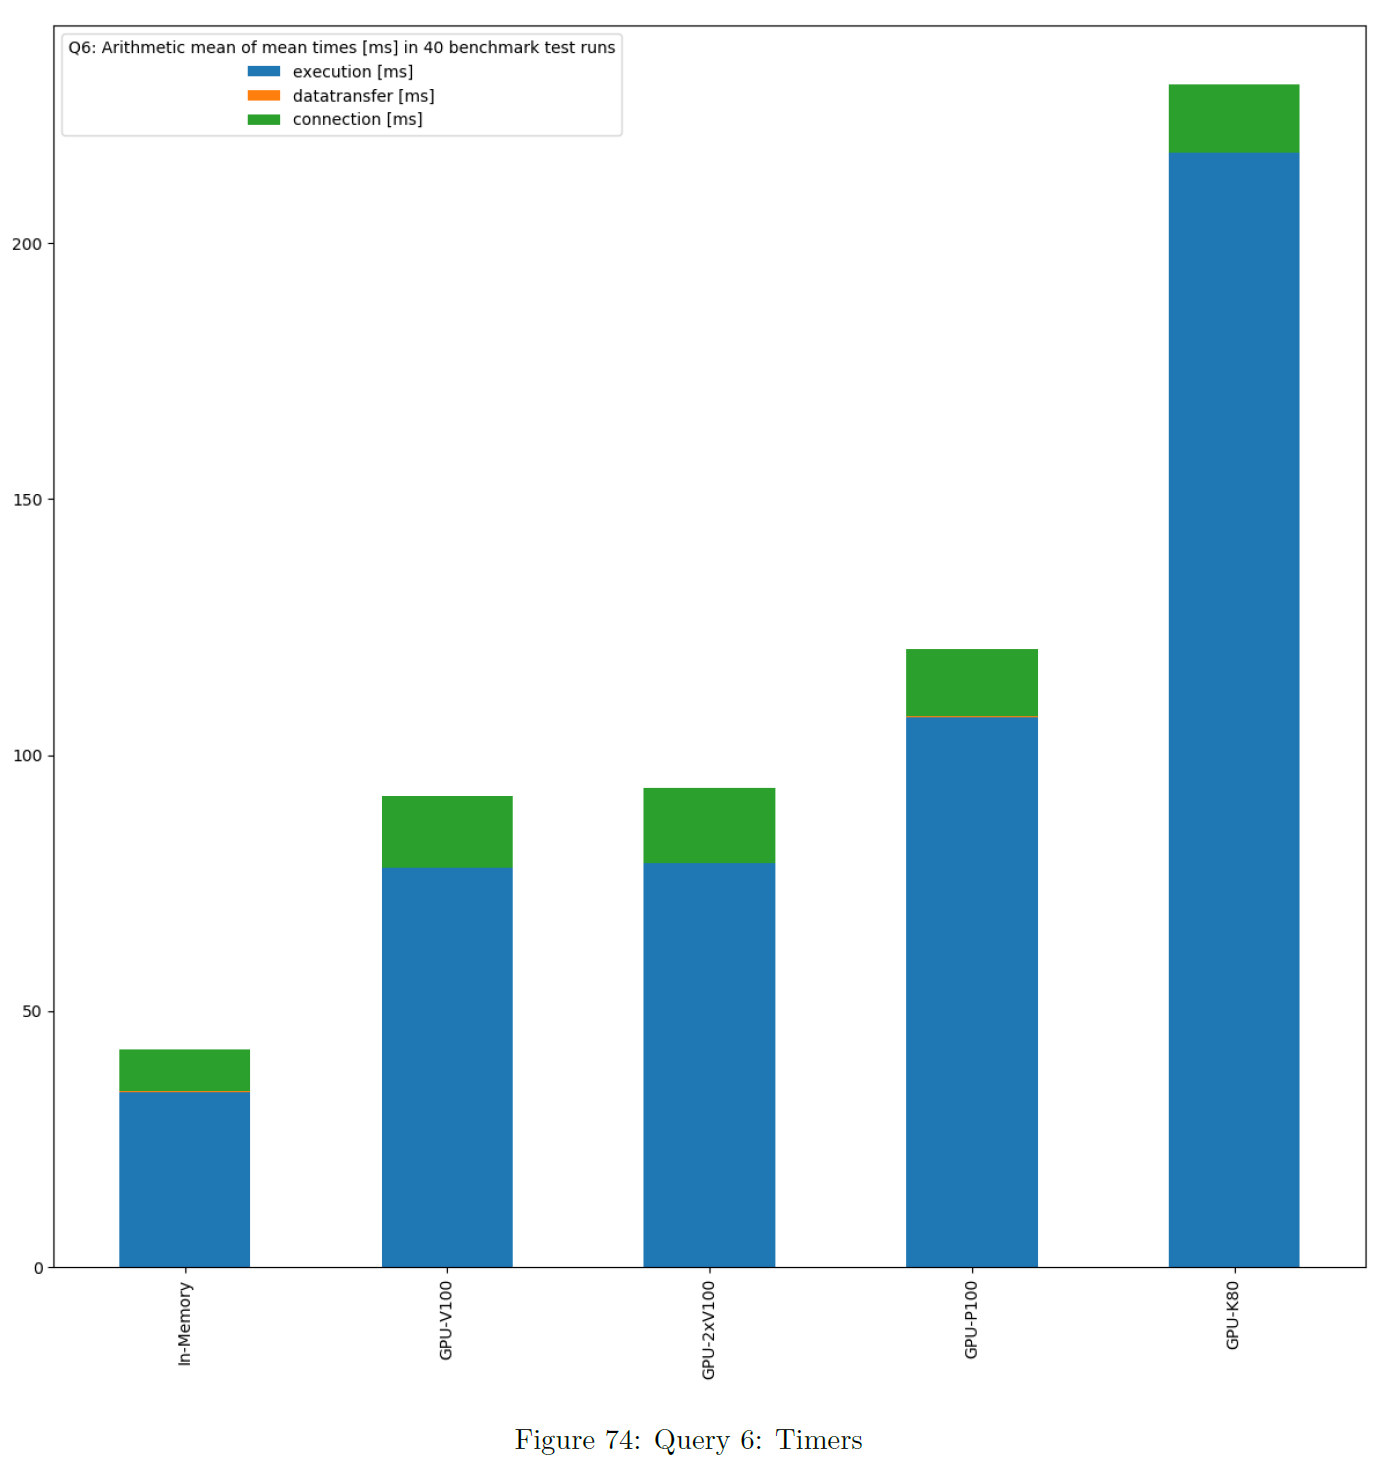
This is based on the sum of times of all single benchmark test runs. These charts show the average of times per DBMS based on mean value. Warmup and cooldown are not included. If data transfer or connection time is also benchmarked, the chart is stacked. The bars are ordered ascending.
Slice Queries and Timers
Statistics Table
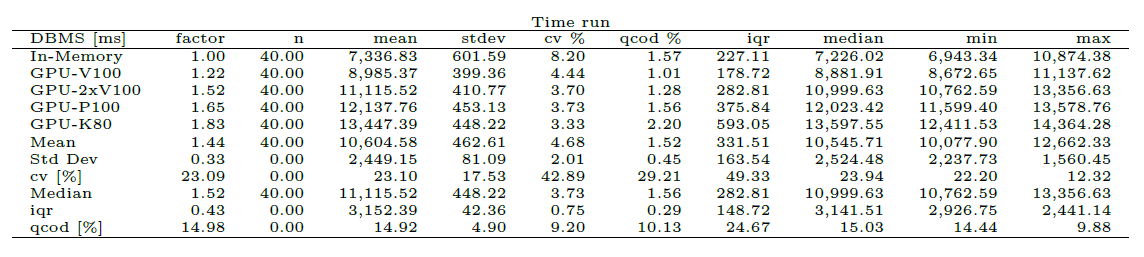
These tables show statistics about benchmarking time during the various runs per DBMS as a table. Warmup and cooldown are not included. This is for inspection of stability. A factor column is included. This is computed as the multiple of the minimum of the mean of benchmark times per DBMS. The DBMS are ordered ascending by factor.
Plot of Values
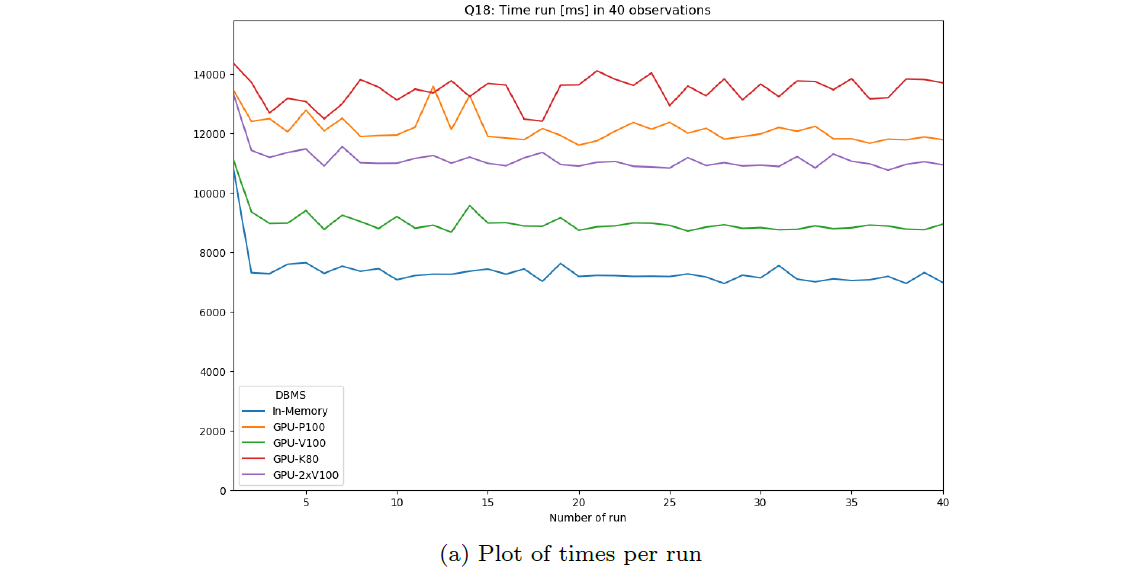
These plots show the variation of benchmarking time during the various runs per DBMS as a plot. Warmup and cooldown are included and marked as such. This is for inspection of time dependence.
Note this is only reliable for non-parallel runs.
Boxplot of Values
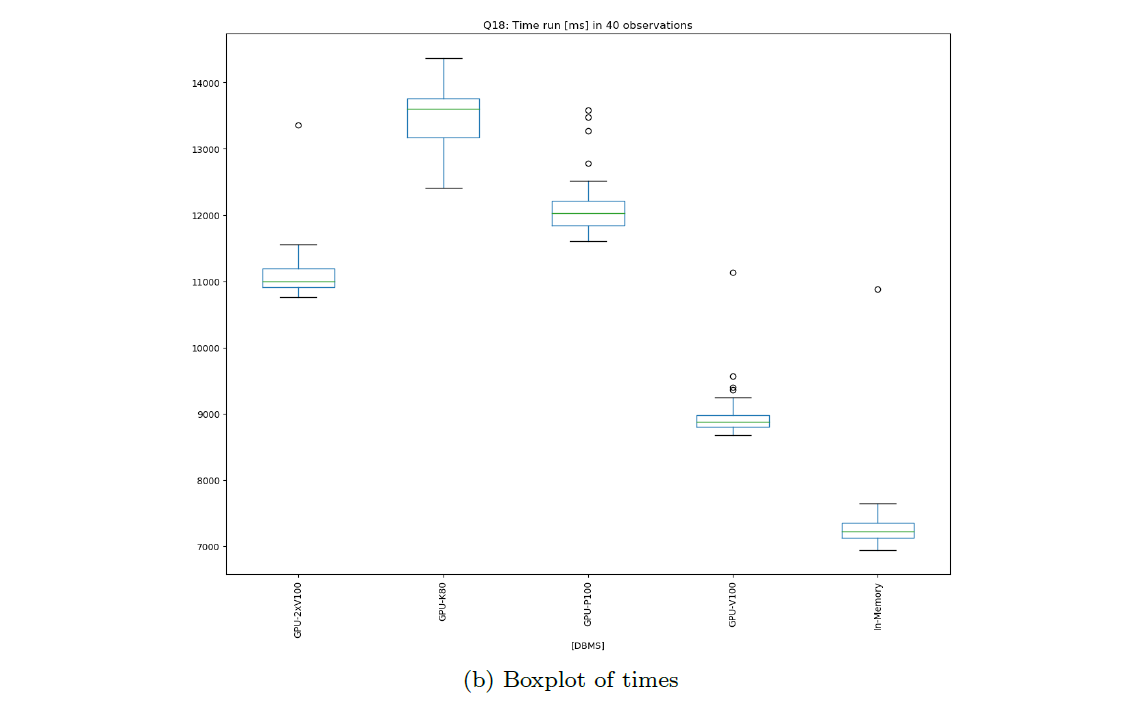
These plots show the variation of benchmarking time during the various runs per DBMS as a boxplot. Warmup, cooldown and zero (missing) values are not included. This is for inspection of variation and outliers.
Histogram of Values
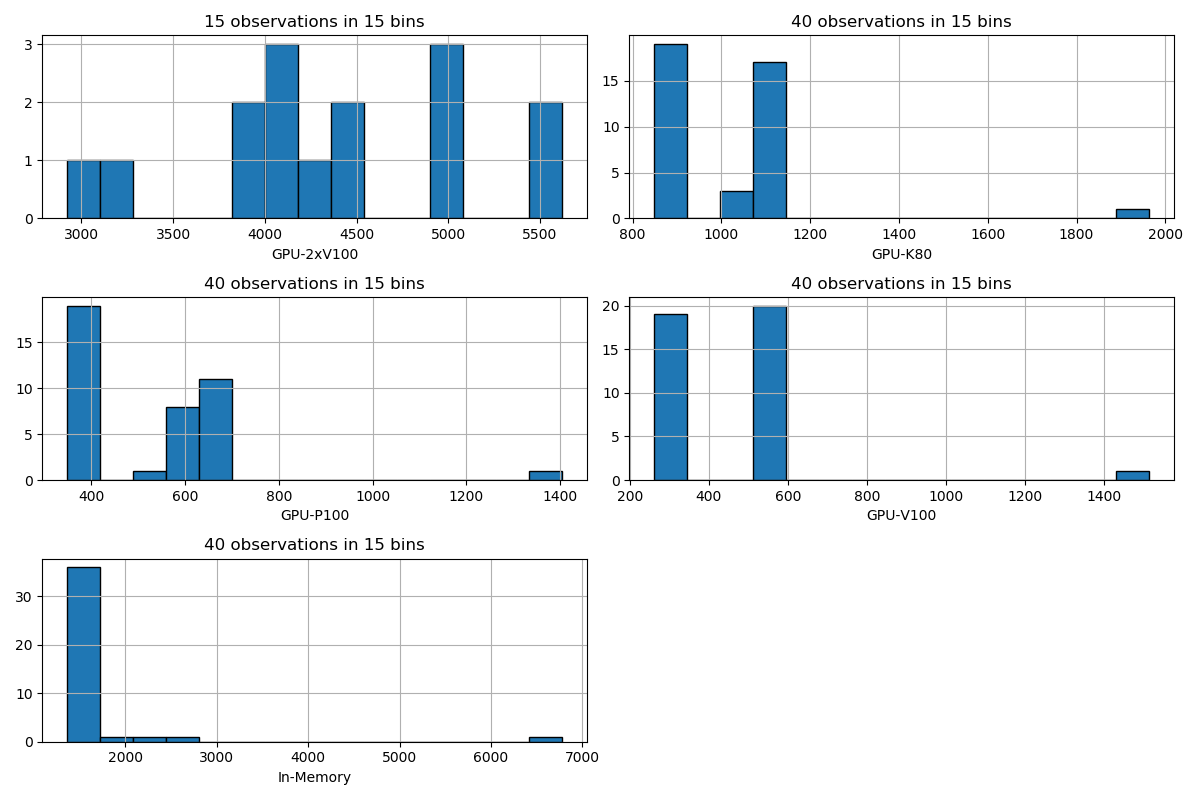
These plots show the variation of benchmarking time during the various runs per DBMS as a histogram. The number of bins equals the minimum number of result times. Warmup, cooldown and zero (missing) values are not included. This is for inspection of the distribution of times.
Further Data
Result Sets per Query
The result set (sorted values, hashed or pure size) of the first run of each DBMS can be saved per query. This is for comparison and inspection.
All Benchmark Times
The benchmark times of all runs of each DBMS can be saved per query. This is for comparison and inspection.
All Errors
The errors that may have occured are saved for each DBMS and per query. The error messages are fetched from Python exceptions thrown during a benchmark run. This is for inspection of problems.
All Warnings
The warnings that may have occured are saved for each DBMS and per query. The warning messages are generated if comparison of result sets detects any difference. This is for inspection of problems.
Initialization Scripts
If the result folder contains init scripts, they will be included in the dashboard.
Bexhoma Workflow
If the result folder contains the configuration of a bexhoma workflow, it will be included in the dashboard.